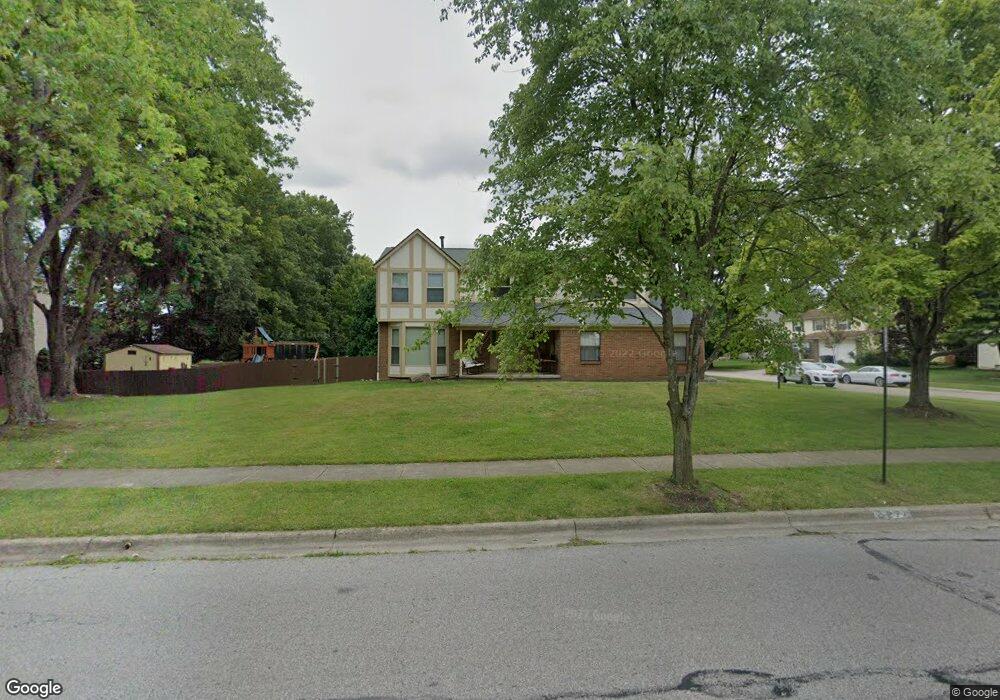
2271 Sutter Pkwy Dublin, OH 43016
Olde Sawmill NeighborhoodEstimated Value: $460,000 - $492,000
4
Beds
3
Baths
2,700
Sq Ft
$176/Sq Ft
Est. Value
About This Home
This home is located at 2271 Sutter Pkwy, Dublin, OH 43016 and is currently estimated at $474,441, approximately $175 per square foot. 2271 Sutter Pkwy is a home located in Franklin County with nearby schools including Olde Sawmill Elementary School, Ann Simpson Davis Middle School, and Dublin Scioto High School.
Ownership History
Date
Name
Owned For
Owner Type
Purchase Details
Closed on
May 18, 2011
Sold by
Meyer Marty M and Meyer Lisa M
Bought by
Finisterre Kevin R and Finisterre Sarah E
Current Estimated Value
Home Financials for this Owner
Home Financials are based on the most recent Mortgage that was taken out on this home.
Original Mortgage
$200,737
Outstanding Balance
$136,660
Interest Rate
4.75%
Mortgage Type
FHA
Estimated Equity
$337,781
Purchase Details
Closed on
Jul 24, 2003
Sold by
Mindlin Aleksandr and Mindlin Tatyana
Bought by
Meyer Marty M and Meyer Lisa M
Home Financials for this Owner
Home Financials are based on the most recent Mortgage that was taken out on this home.
Original Mortgage
$177,000
Interest Rate
5.3%
Mortgage Type
Purchase Money Mortgage
Purchase Details
Closed on
Mar 1, 1994
Bought by
Mindlin Aleksandr
Purchase Details
Closed on
Dec 14, 1988
Create a Home Valuation Report for This Property
The Home Valuation Report is an in-depth analysis detailing your home's value as well as a comparison with similar homes in the area
Home Values in the Area
Average Home Value in this Area
Purchase History
| Date | Buyer | Sale Price | Title Company |
|---|---|---|---|
| Finisterre Kevin R | $206,000 | Associates | |
| Meyer Marty M | $197,000 | Landsel Title Agency Inc | |
| Mindlin Aleksandr | $117,500 | -- | |
| -- | $117,400 | -- |
Source: Public Records
Mortgage History
| Date | Status | Borrower | Loan Amount |
|---|---|---|---|
| Open | Finisterre Kevin R | $200,737 | |
| Previous Owner | Meyer Marty M | $177,000 |
Source: Public Records
Tax History
| Year | Tax Paid | Tax Assessment Tax Assessment Total Assessment is a certain percentage of the fair market value that is determined by local assessors to be the total taxable value of land and additions on the property. | Land | Improvement |
|---|---|---|---|---|
| 2025 | $8,192 | $135,450 | $36,750 | $98,700 |
| 2024 | $8,192 | $135,450 | $36,750 | $98,700 |
| 2023 | $8,077 | $135,450 | $36,750 | $98,700 |
| 2022 | $10,016 | $103,500 | $17,850 | $85,650 |
| 2021 | $6,749 | $103,500 | $17,850 | $85,650 |
| 2020 | $6,783 | $104,650 | $17,850 | $86,800 |
| 2019 | $6,368 | $86,980 | $14,880 | $72,100 |
| 2018 | $5,742 | $86,980 | $14,880 | $72,100 |
| 2017 | $5,879 | $86,980 | $14,880 | $72,100 |
| 2016 | $5,060 | $70,320 | $20,690 | $49,630 |
| 2015 | $5,092 | $70,320 | $20,690 | $49,630 |
| 2014 | $5,097 | $70,320 | $20,690 | $49,630 |
| 2013 | $2,587 | $70,315 | $20,685 | $49,630 |
Source: Public Records
Map
Nearby Homes
- 2423 Sutter Pkwy
- 2074 Hard Rd
- 1986 Sutter Pkwy
- 2469 Sandstrom Dr
- 2456 Sanford Dr
- 2475 Slateshire Dr
- 2620 Cedar Lake Dr Unit 2620
- 7746 Sagemeadow Ct
- 2001 Sawbury Blvd Unit 2001
- 7898 Sarahurst Dr
- 7907 Sarahurst Dr
- 7887 Thornfield Ln Unit 50
- 7891 Thornfield Ln Unit 48
- 7912 Meadowhaven Blvd Unit 30
- 1908 Lost Valley Rd
- 7853 Meadowhaven Blvd Unit 63
- 7847 Meadowhaven Blvd Unit 66
- 2691 Sawmill Forest Ave
- 7456 Mapleleaf Ct
- 8205 Longhorn Rd
- 7496 Gardenview Place
- 2245 Sutter Pkwy
- 7488 Gardenview Place
- 2233 Sutter Pkwy
- 2293 Sutter Pkwy
- 7493 Gardenview Place
- 7480 Gardenview Place
- 2225 Sutter Pkwy
- 7552 Seddon Dr
- 7485 Gardenview Place
- 7472 Gardenview Place
- 2217 Sutter Pkwy
- 7477 Gardenview Place
- 2222 Sutter Pkwy
- 7496 Gardengate Place
- 7464 Gardenview Place
- 7488 Gardengate Place
- 7469 Gardenview Place
- 2231 Scottingham Dr
- 2209 Sutter Pkwy