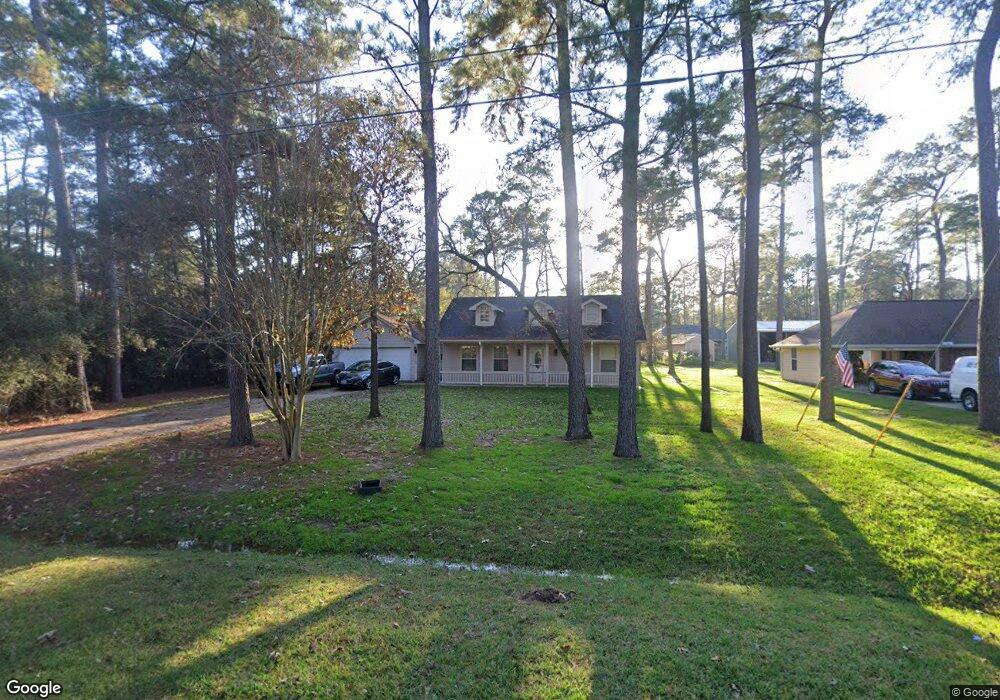
22713 Blackgum Dr Magnolia, TX 77355
Clear Creek Forest NeighborhoodEstimated Value: $296,000 - $364,000
--
Bed
2
Baths
1,260
Sq Ft
$253/Sq Ft
Est. Value
About This Home
This home is located at 22713 Blackgum Dr, Magnolia, TX 77355 and is currently estimated at $319,244, approximately $253 per square foot. 22713 Blackgum Dr is a home located in Montgomery County with nearby schools including J.L. Lyon Elementary School, Magnolia Sixth Grade Campus, and Magnolia Junior High School.
Ownership History
Date
Name
Owned For
Owner Type
Purchase Details
Closed on
Jul 24, 2015
Sold by
Fugle John and Fugle Kathy
Bought by
Matthys Jeremie
Current Estimated Value
Home Financials for this Owner
Home Financials are based on the most recent Mortgage that was taken out on this home.
Original Mortgage
$158,230
Outstanding Balance
$124,319
Interest Rate
4.08%
Mortgage Type
VA
Estimated Equity
$194,925
Purchase Details
Closed on
Dec 4, 2006
Sold by
Rich Budin Builder Inc
Bought by
Fugle John and Fugle Kathy
Home Financials for this Owner
Home Financials are based on the most recent Mortgage that was taken out on this home.
Original Mortgage
$118,000
Interest Rate
6.37%
Mortgage Type
Seller Take Back
Purchase Details
Closed on
Dec 13, 2004
Sold by
Neatherlin Homes Inc
Bought by
Matthys Jeremie
Create a Home Valuation Report for This Property
The Home Valuation Report is an in-depth analysis detailing your home's value as well as a comparison with similar homes in the area
Home Values in the Area
Average Home Value in this Area
Purchase History
| Date | Buyer | Sale Price | Title Company |
|---|---|---|---|
| Matthys Jeremie | -- | Alamo Title Co | |
| Fugle John | -- | Stewart Title Houston Div | |
| Matthys Jeremie | -- | -- | |
| Rich Budin Builder Inc | -- | Stewart Title |
Source: Public Records
Mortgage History
| Date | Status | Borrower | Loan Amount |
|---|---|---|---|
| Open | Matthys Jeremie | $158,230 | |
| Previous Owner | Fugle John | $118,000 |
Source: Public Records
Tax History Compared to Growth
Tax History
| Year | Tax Paid | Tax Assessment Tax Assessment Total Assessment is a certain percentage of the fair market value that is determined by local assessors to be the total taxable value of land and additions on the property. | Land | Improvement |
|---|---|---|---|---|
| 2025 | $4,387 | $284,431 | $54,783 | $229,648 |
| 2024 | $4,272 | $277,084 | $54,783 | $222,301 |
| 2023 | $4,272 | $270,620 | $54,780 | $215,840 |
| 2022 | $4,815 | $272,870 | $72,320 | $200,550 |
| 2021 | $3,901 | $209,870 | $54,780 | $155,090 |
| 2020 | $3,943 | $194,830 | $54,780 | $140,050 |
| 2019 | $3,794 | $188,380 | $54,780 | $133,600 |
| 2018 | $3,671 | $173,660 | $28,450 | $145,210 |
| 2017 | $3,748 | $176,730 | $28,450 | $148,280 |
| 2016 | $3,530 | $166,460 | $28,450 | $138,010 |
| 2015 | $2,872 | $158,280 | $28,450 | $131,540 |
| 2014 | $2,872 | $143,890 | $7,010 | $136,880 |
Source: Public Records
Map
Nearby Homes
- 22922 Blackgum Dr
- 22806 Lantana Dr
- 22710 Meadowsweet Dr
- 22920 Blackgum Dr
- 22219 Rainfern Dr
- 30003 Desert Willow Ct
- 22403 Meadowsweet Dr
- 30103 Thousand Oaks Ct
- 25903 Penguin St
- 25402 Holly Oaks Ct
- 30311 N Holly Oaks Cir
- 0 Baneberry
- 20127 Sapphire Cir
- 25103 Lake Park Ct
- 22102 Badger Hollow Dr
- 20002 Sapphire Cir
- 24445 Pipestem Dr
- 21610 Meadowsweet Dr
- 27141 Nichols Sawmill Rd
- 289 Pelican St
- 22715 Blackgum Dr
- 22711 Blackgum Dr
- 22803 Blackgum Dr
- 22714 Rainfern Dr
- 22703 Blackgum Dr
- 22918 Blackgum Dr
- 22718 Rainfern Dr
- 22710 Rainfern Dr
- 22802 Rainfern Dr
- 22807 Blackgum Dr
- 22802 Blackgum Dr
- 22804 Rainfern Dr
- 22702 Rainfern Dr
- 22806 Blackgum Dr
- 22619 Blackgum Dr
- 22711 Rainfern Dr
- 22810 Blackgum Dr
- 22715 Rainfern Dr
- 22815 Blackgum Dr
- 22719 Rainfern Dr