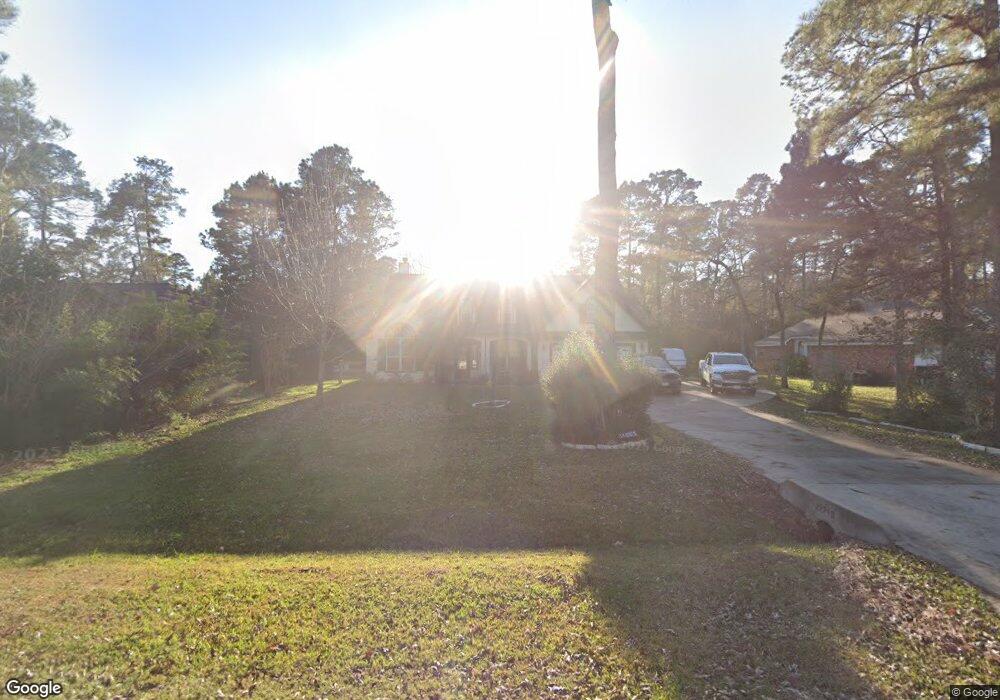
22719 Lantana Dr Magnolia, TX 77355
Clear Creek Forest NeighborhoodEstimated Value: $429,771 - $524,000
--
Bed
1
Bath
2,247
Sq Ft
$204/Sq Ft
Est. Value
About This Home
This home is located at 22719 Lantana Dr, Magnolia, TX 77355 and is currently estimated at $459,443, approximately $204 per square foot. 22719 Lantana Dr is a home located in Montgomery County with nearby schools including J.L. Lyon Elementary School, Magnolia Sixth Grade Campus, and Magnolia Junior High School.
Ownership History
Date
Name
Owned For
Owner Type
Purchase Details
Closed on
Feb 23, 2006
Sold by
Fowler Jon P and Fowler Virginia C
Bought by
Campbell Robert and Campbell Sabrina
Current Estimated Value
Home Financials for this Owner
Home Financials are based on the most recent Mortgage that was taken out on this home.
Original Mortgage
$190,008
Outstanding Balance
$106,269
Interest Rate
6.09%
Mortgage Type
FHA
Estimated Equity
$353,174
Purchase Details
Closed on
Oct 14, 2005
Sold by
Cannon Construction Co Inc
Bought by
Fowler Jon P and Fowler Virginia C
Home Financials for this Owner
Home Financials are based on the most recent Mortgage that was taken out on this home.
Original Mortgage
$169,978
Interest Rate
5.65%
Mortgage Type
Fannie Mae Freddie Mac
Purchase Details
Closed on
May 26, 2005
Sold by
Neel David
Bought by
Cannon Construction Co Inc
Home Financials for this Owner
Home Financials are based on the most recent Mortgage that was taken out on this home.
Original Mortgage
$114,200
Interest Rate
5.83%
Mortgage Type
Purchase Money Mortgage
Purchase Details
Closed on
Mar 18, 2005
Sold by
Sykora Patricia Eileen Mackey and Mackey Daniel William
Bought by
Neel David
Create a Home Valuation Report for This Property
The Home Valuation Report is an in-depth analysis detailing your home's value as well as a comparison with similar homes in the area
Home Values in the Area
Average Home Value in this Area
Purchase History
| Date | Buyer | Sale Price | Title Company |
|---|---|---|---|
| Campbell Robert | -- | First American Title | |
| Fowler Jon P | -- | Chicago Title | |
| Cannon Construction Co Inc | -- | Chicago Title | |
| Neel David | -- | Chicago Title |
Source: Public Records
Mortgage History
| Date | Status | Borrower | Loan Amount |
|---|---|---|---|
| Open | Campbell Robert | $190,008 | |
| Previous Owner | Fowler Jon P | $169,978 | |
| Previous Owner | Cannon Construction Co Inc | $114,200 |
Source: Public Records
Tax History Compared to Growth
Tax History
| Year | Tax Paid | Tax Assessment Tax Assessment Total Assessment is a certain percentage of the fair market value that is determined by local assessors to be the total taxable value of land and additions on the property. | Land | Improvement |
|---|---|---|---|---|
| 2025 | $4,922 | $423,240 | $54,453 | $368,787 |
| 2024 | $4,374 | $395,054 | -- | -- |
| 2023 | $4,374 | $359,140 | $54,450 | $341,720 |
| 2022 | $5,761 | $326,490 | $71,880 | $317,470 |
| 2021 | $5,517 | $296,810 | $54,450 | $242,360 |
| 2020 | $5,530 | $273,250 | $54,450 | $218,800 |
| 2019 | $5,250 | $260,670 | $54,450 | $206,220 |
| 2018 | $4,717 | $252,300 | $28,320 | $223,980 |
| 2017 | $5,450 | $257,010 | $28,320 | $228,690 |
| 2016 | $5,095 | $240,280 | $28,320 | $211,960 |
| 2015 | $4,422 | $233,300 | $28,320 | $204,980 |
| 2014 | $4,422 | $216,140 | $6,970 | $209,170 |
Source: Public Records
Map
Nearby Homes
- 22806 Lantana Dr
- 22710 Meadowsweet Dr
- 22922 Blackgum Dr
- 30003 Desert Willow Ct
- 22920 Blackgum Dr
- 22403 Meadowsweet Dr
- 30103 Thousand Oaks Ct
- 22219 Rainfern Dr
- 0 Baneberry
- 30311 N Holly Oaks Cir
- 25402 Holly Oaks Ct
- 25903 Penguin St
- 25103 Lake Park Ct
- 20127 Sapphire Cir
- 24445 Pipestem Dr
- 22102 Badger Hollow Dr
- 20002 Sapphire Cir
- 289 Pelican St
- 451 Pelican St
- 21610 Meadowsweet Dr
- 22803 Lantana Dr
- 22715 Lantana Dr
- 22807 Lantana Dr
- 22711 Lantana Dr
- 22806 Meadowsweet Dr
- 22802 Meadowsweet Dr
- 22802 Lantana Dr
- 22718 Meadowsweet Dr
- 22810 Meadowsweet Dr
- 22811 Lantana Dr
- 22707 Lantana Dr
- 22714 Lantana Dr
- 22714 Meadowsweet Dr
- 22814 Meadowsweet Dr
- 22810 Lantana Dr
- 22710 Lantana Dr
- 22815 Lantana Dr
- 22703 Lantana Dr
- 22814 Lantana Dr
- 22818 Meadowsweet Dr