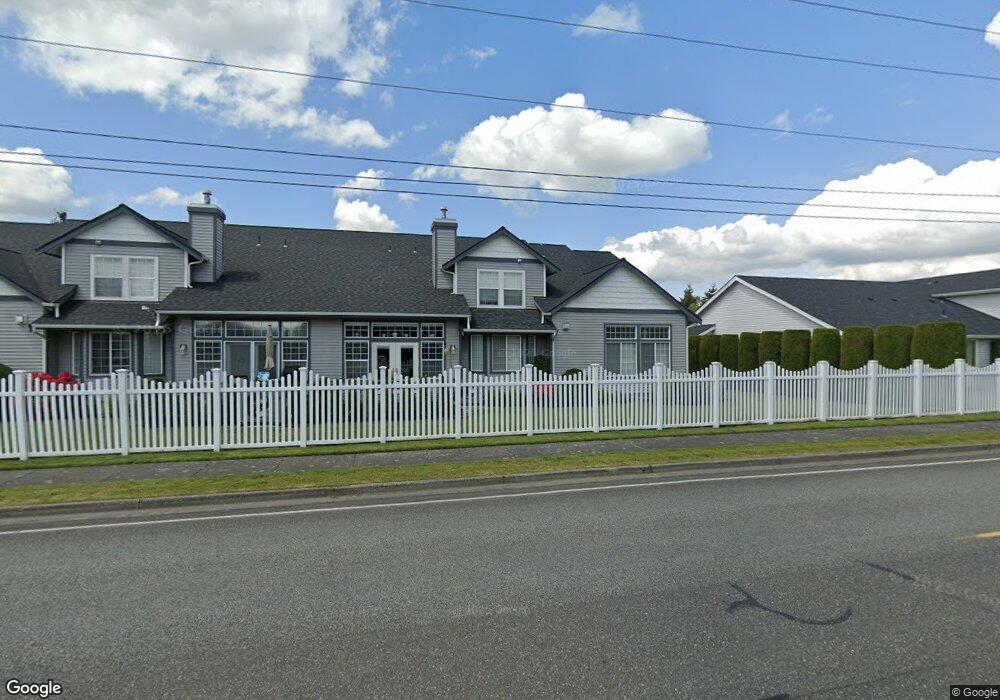
2272 James Cir Lynden, WA 98264
Estimated Value: $500,000 - $552,091
3
Beds
3
Baths
2,159
Sq Ft
$242/Sq Ft
Est. Value
About This Home
This home is located at 2272 James Cir, Lynden, WA 98264 and is currently estimated at $522,023, approximately $241 per square foot. 2272 James Cir is a home located in Whatcom County with nearby schools including Lynden High School, Cornerstone Christian School, and Covenant Christian School.
Ownership History
Date
Name
Owned For
Owner Type
Purchase Details
Closed on
Oct 23, 2023
Sold by
Dykstra Glen A and Dykstra Alice P
Bought by
Ridge Rentals 2D Llc
Current Estimated Value
Purchase Details
Closed on
Oct 19, 2020
Sold by
Jana Clow
Bought by
Dykstra Glen A and Dykstra Alice P
Purchase Details
Closed on
Apr 21, 2015
Sold by
Hsbc Bank Usa National Association
Bought by
Clow Jana
Purchase Details
Closed on
Mar 9, 2015
Sold by
Petrone Dean and Petrone Connie
Bought by
Hsbc Bank Usa National Association
Purchase Details
Closed on
Nov 23, 2004
Sold by
Petrone Connie
Bought by
Petrone Dean J
Create a Home Valuation Report for This Property
The Home Valuation Report is an in-depth analysis detailing your home's value as well as a comparison with similar homes in the area
Home Values in the Area
Average Home Value in this Area
Purchase History
| Date | Buyer | Sale Price | Title Company |
|---|---|---|---|
| Ridge Rentals 2D Llc | $313 | Whatcom Land Title | |
| Dykstra Glen A | $5,845,000 | Chicago Title | |
| Dykstra Glen A | $365,000 | Chicago Title Bellingham | |
| Clow Jana | $212,000 | Nextitle | |
| Hsbc Bank Usa National Association | $210,000 | None Available | |
| Petrone Dean J | -- | Chicago Title Insurance | |
| Petrone Dean J | -- | Chicago Title Insurance |
Source: Public Records
Tax History Compared to Growth
Tax History
| Year | Tax Paid | Tax Assessment Tax Assessment Total Assessment is a certain percentage of the fair market value that is determined by local assessors to be the total taxable value of land and additions on the property. | Land | Improvement |
|---|---|---|---|---|
| 2024 | $3,271 | $455,210 | $45,000 | $410,210 |
| 2023 | $3,271 | $455,210 | $45,000 | $410,210 |
| 2022 | $3,293 | $403,947 | $77,958 | $325,989 |
| 2021 | $3,289 | $357,476 | $68,990 | $288,486 |
| 2020 | $2,977 | $324,972 | $62,717 | $262,255 |
| 2019 | $2,640 | $308,020 | $59,445 | $248,575 |
| 2018 | $2,768 | $280,040 | $54,045 | $225,995 |
| 2017 | $2,104 | $241,100 | $46,530 | $194,570 |
| 2016 | $2,043 | $194,948 | $48,330 | $146,618 |
| 2015 | $1,741 | $188,279 | $46,440 | $141,839 |
| 2014 | -- | $174,883 | $43,155 | $131,728 |
| 2013 | -- | $172,954 | $42,750 | $130,204 |
Source: Public Records
Map
Nearby Homes
- 2201 Dejong Dr
- 2205 Dejong Dr
- 8885 Line Rd
- 1660 Eastwood Way
- 1136 N Cascade Ct
- 1112 N Cascade Ct
- 1725 Aaron Dr
- 2202 Berryman Loop
- 1402 Bradley Meadows Ln
- 1319 Bradley Ct
- 1251 Garden Cir
- 9586 Bender Rd
- 8639 Bender Rd
- 114 Twin Sister Loop
- 1178 E Grover St Unit 101
- 1340 Kamm Rd
- 1792 Bradley Rd
- 2021 Brome St
- 2029 Brome St
- 107 Springview Dr
- 2272 James Cir Unit D
- 2272 James Cir Unit C
- 2272 James Cir Unit B
- 2272 James Cir Unit A
- 2260 James Cir Unit B
- 2260 James Cir Unit A
- 2260 James Cir Unit A
- 2284 James Cir Unit B
- 2284 James Cir Unit A
- 2284 James Cir Unit A
- 2284 James Cir Unit C
- 1161 Aaron Dr
- 1161 Aaron Dr Unit C
- 1161 Aaron Dr Unit B
- 1161 Aaron Dr Unit A
- 1161 Aaron Dr Unit C
- 1239 Spruce Cir Unit A
- 1239 Spruce Cir Unit B
- 1247 Spruce Cir Unit A
- 1247 Spruce Cir Unit B