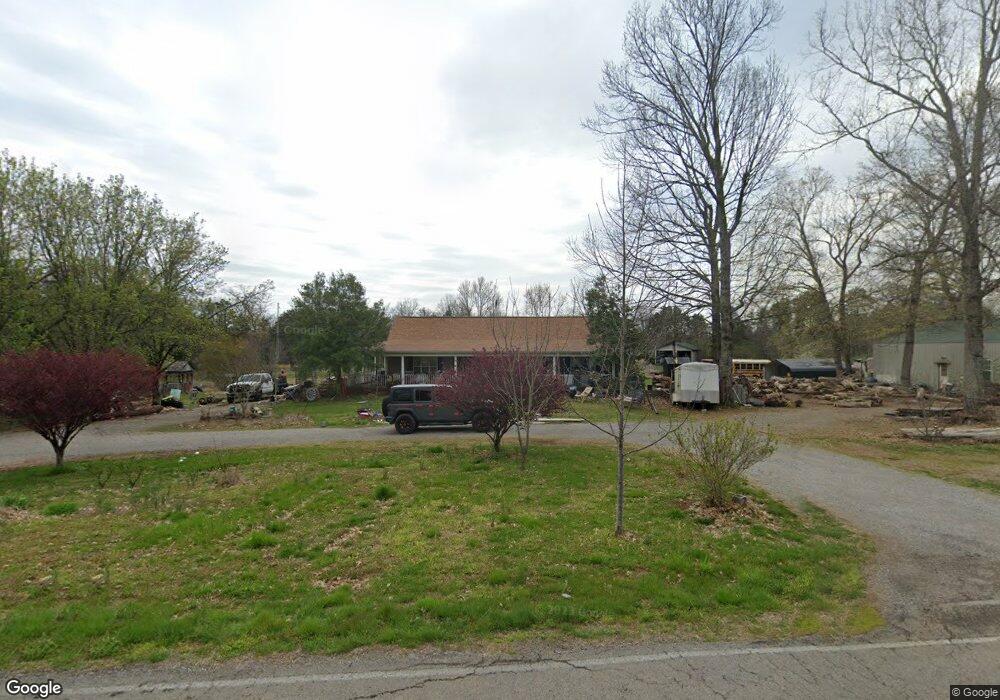
2272 Mount Lebanon Rd Lewisburg, TN 37091
Estimated Value: $487,071 - $498,000
--
Bed
2
Baths
2,632
Sq Ft
$187/Sq Ft
Est. Value
About This Home
This home is located at 2272 Mount Lebanon Rd, Lewisburg, TN 37091 and is currently estimated at $492,268, approximately $187 per square foot. 2272 Mount Lebanon Rd is a home located in Marshall County with nearby schools including Oak Grove Elementary School, Marshall Elementary School, and Westhills Elementary School.
Ownership History
Date
Name
Owned For
Owner Type
Purchase Details
Closed on
Jun 28, 2005
Sold by
Mai Scott Peggy
Bought by
Ricky Black and Ricky Rebecca
Current Estimated Value
Purchase Details
Closed on
Dec 20, 1996
Sold by
Anthony Rogers
Bought by
Larry Dunnivant and Larry Amy
Purchase Details
Closed on
Nov 25, 1996
Bought by
Black Ricky L and Black Rebecca A
Purchase Details
Closed on
Oct 31, 1996
Sold by
Mealer William Edward & Pa
Bought by
Anthony Rogers
Purchase Details
Closed on
Sep 13, 1996
Sold by
House John Wesley
Bought by
Mealer William Edward & Pa
Purchase Details
Closed on
Sep 5, 1996
Sold by
House John Wesley
Bought by
Nelson Terry R
Purchase Details
Closed on
May 17, 1996
Sold by
Ann Roberts Mary
Bought by
Mills Terry K and Mills Charlene
Purchase Details
Closed on
May 9, 1996
Sold by
Ann Roberts Mary
Bought by
Douglas Blankenship and Douglas Pris
Create a Home Valuation Report for This Property
The Home Valuation Report is an in-depth analysis detailing your home's value as well as a comparison with similar homes in the area
Home Values in the Area
Average Home Value in this Area
Purchase History
| Date | Buyer | Sale Price | Title Company |
|---|---|---|---|
| Ricky Black | -- | -- | |
| Larry Dunnivant | $43,000 | -- | |
| Black Ricky L | $2,000 | -- | |
| Anthony Rogers | $30,000 | -- | |
| Mealer William Edward & Pa | $18,500 | -- | |
| Nelson Terry R | $12,500 | -- | |
| Mills Terry K | $46,250 | -- | |
| Douglas Blankenship | $4,750 | -- |
Source: Public Records
Tax History Compared to Growth
Tax History
| Year | Tax Paid | Tax Assessment Tax Assessment Total Assessment is a certain percentage of the fair market value that is determined by local assessors to be the total taxable value of land and additions on the property. | Land | Improvement |
|---|---|---|---|---|
| 2024 | $1,768 | $97,200 | $29,475 | $67,725 |
| 2023 | $1,768 | $97,200 | $29,475 | $67,725 |
| 2022 | $1,768 | $97,200 | $29,475 | $67,725 |
| 2021 | $1,443 | $51,325 | $6,500 | $44,825 |
| 2020 | $1,443 | $51,325 | $6,500 | $44,825 |
| 2019 | $1,443 | $51,325 | $6,500 | $44,825 |
| 2018 | $1,379 | $51,325 | $6,500 | $44,825 |
| 2017 | $1,379 | $49,925 | $6,500 | $43,425 |
| 2016 | $1,437 | $44,625 | $6,600 | $38,025 |
| 2015 | $1,437 | $44,625 | $6,600 | $38,025 |
| 2014 | $1,437 | $44,625 | $6,600 | $38,025 |
Source: Public Records
Map
Nearby Homes
- 3327 Nashville Hwy
- 3293 Nashville Hwy
- 2555 Bob Cheek Rd
- 2137 Horton Way
- 0 Nashville Hwy Unit RTC3045409
- 0 Nashville Hwy Unit RTC2970248
- 0 Nashville Hwy Unit RTC2975994
- 3560 Nashville Hwy
- 3600 Nashville Hwy
- 3130 Nashville Hwy
- 3077 Nashville Hwy
- 2220 Hunter Bills Rd
- 0 Anes Station Rd
- 3388 Anes Station Rd
- 3124 Rich Dr
- 2309 Hunter Rd
- 1820 Wade Brown Rd
- 360 Laws Hill Rd
- 350 Laws Hill Rd
- 2150 Highway 40
- 2310 Mount Lebanon Rd
- 2242 Mount Lebanon Rd
- 2234 Mount Lebanon Rd
- 2354 Mount Lebanon Rd
- 2323 Mount Lebanon Rd
- 2343 Mount Lebanon Rd
- 2214 Mount Lebanon Rd
- 2394 Mount Lebanon Rd
- 3297 Nashville Hwy
- 2456 Mount Lebanon Rd
- 3367 Nashville Hwy
- 3345 Nashville Hwy
- 3395 Nashville Hwy
- 3317 Nashville Hwy
- 3411 Nashville Hwy
- 3275 Nashville Hwy
- 3295 Nashville Hwy
- 2391 Mount Lebanon Rd
- 2411 Mount Lebanon Rd
- 3330 Nashville Hwy