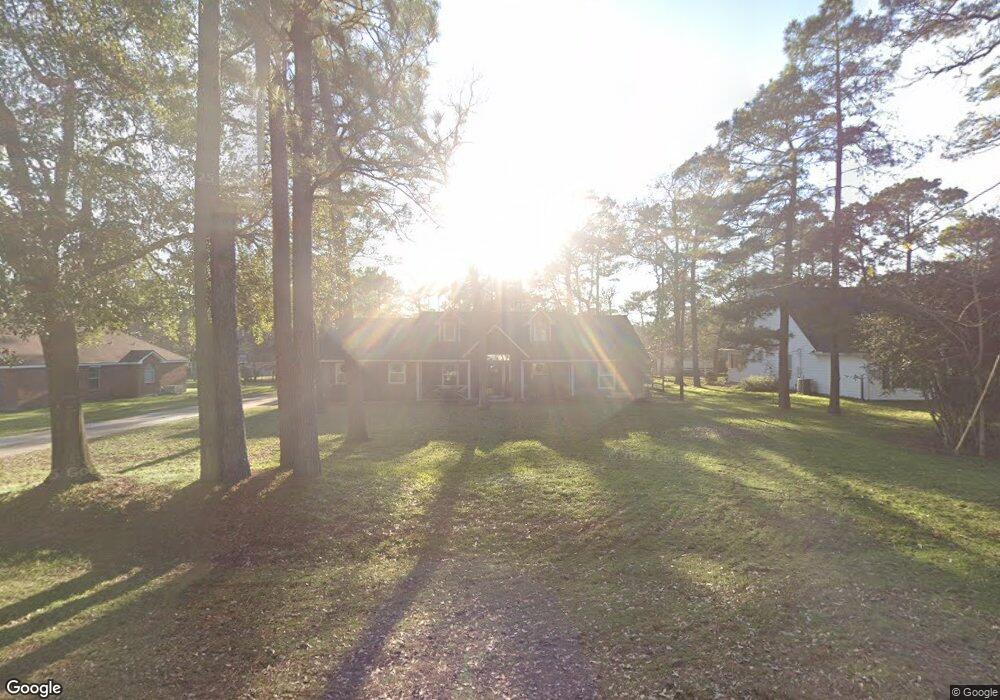
22725 Desert Willow Dr Magnolia, TX 77355
Clear Creek Forest NeighborhoodEstimated Value: $299,025 - $388,000
3
Beds
2
Baths
1,249
Sq Ft
$274/Sq Ft
Est. Value
About This Home
This home is located at 22725 Desert Willow Dr, Magnolia, TX 77355 and is currently estimated at $342,006, approximately $273 per square foot. 22725 Desert Willow Dr is a home located in Montgomery County with nearby schools including J.L. Lyon Elementary School, Magnolia Sixth Grade Campus, and Magnolia Junior High School.
Ownership History
Date
Name
Owned For
Owner Type
Purchase Details
Closed on
Feb 24, 2020
Sold by
Vongontard Chris and Vongontard Chris
Bought by
Vongontard Chris Von and Vongontard Laurie Von
Current Estimated Value
Home Financials for this Owner
Home Financials are based on the most recent Mortgage that was taken out on this home.
Original Mortgage
$110,000
Outstanding Balance
$76,351
Interest Rate
3.6%
Mortgage Type
New Conventional
Estimated Equity
$265,655
Purchase Details
Closed on
Jul 4, 2000
Sold by
Hardee Texstar Homes Inc
Bought by
Vongontard Chris
Home Financials for this Owner
Home Financials are based on the most recent Mortgage that was taken out on this home.
Original Mortgage
$70,000
Interest Rate
8.21%
Purchase Details
Closed on
Jan 4, 2000
Sold by
Fox Glenna J
Bought by
Hardee Texstar Homes Inc
Purchase Details
Closed on
Sep 1, 1982
Sold by
Perry Ellar B
Bought by
Vongontard Chris
Create a Home Valuation Report for This Property
The Home Valuation Report is an in-depth analysis detailing your home's value as well as a comparison with similar homes in the area
Home Values in the Area
Average Home Value in this Area
Purchase History
| Date | Buyer | Sale Price | Title Company |
|---|---|---|---|
| Vongontard Chris Von | -- | Solidifi | |
| Vongontard Chris | -- | -- | |
| Vongontard Chris | -- | Chicago Title | |
| Hardee Texstar Homes Inc | -- | -- | |
| Vongontard Chris | -- | -- |
Source: Public Records
Mortgage History
| Date | Status | Borrower | Loan Amount |
|---|---|---|---|
| Open | Vongontard Chris Von | $110,000 | |
| Closed | Vongontard Chris | $70,000 |
Source: Public Records
Tax History Compared to Growth
Tax History
| Year | Tax Paid | Tax Assessment Tax Assessment Total Assessment is a certain percentage of the fair market value that is determined by local assessors to be the total taxable value of land and additions on the property. | Land | Improvement |
|---|---|---|---|---|
| 2025 | $2,986 | $282,632 | $54,453 | $228,179 |
| 2024 | $2,669 | $268,862 | -- | -- |
| 2023 | $2,669 | $244,420 | $54,450 | $213,580 |
| 2022 | $3,921 | $222,200 | $71,880 | $174,120 |
| 2021 | $3,755 | $202,000 | $54,450 | $147,550 |
| 2020 | $3,927 | $194,040 | $54,450 | $139,590 |
| 2019 | $3,796 | $188,480 | $54,450 | $134,030 |
| 2018 | $3,144 | $173,980 | $28,320 | $145,660 |
| 2017 | $3,693 | $174,160 | $28,320 | $145,840 |
| 2016 | $3,520 | $166,000 | $6,970 | $159,030 |
| 2015 | $2,846 | $155,800 | $6,970 | $148,830 |
| 2014 | $2,846 | $142,650 | $6,970 | $137,260 |
Source: Public Records
Map
Nearby Homes
- 22710 Meadowsweet Dr
- 30003 Desert Willow Ct
- 22806 Lantana Dr
- 22922 Blackgum Dr
- 0 Baneberry
- 22403 Meadowsweet Dr
- 22920 Blackgum Dr
- 30103 Thousand Oaks Ct
- 30311 N Holly Oaks Cir
- 22219 Rainfern Dr
- 25103 Lake Park Ct
- 25402 Holly Oaks Ct
- 24445 Pipestem Dr
- 25903 Penguin St
- 289 Pelican St
- 451 Pelican St
- 20127 Sapphire Cir
- 22102 Badger Hollow Dr
- 20002 Sapphire Cir
- 605 Pelican St
- 22729 Desert Willow Dr
- 22715 Desert Willow Dr
- 22802 Coriander Dr
- 22806 Coriander Dr
- 22711 Desert Willow Dr
- 22718 Coriander Dr
- 22810 Coriander Dr
- 22718 Desert Willow Dr
- 22714 Desert Willow Dr
- 22802 Desert Willow Dr
- 22707 Desert Willow Dr
- 22811 Desert Willow Dr
- 22710 Desert Willow Dr
- 22714 Coriander Dr
- 22808 Coriander Dr
- 22806 Desert Willow Dr
- 22706 Desert Willow Dr
- 22710 Coriander Dr
- 22703 Desert Willow Dr
- 22815 Desert Willow Dr