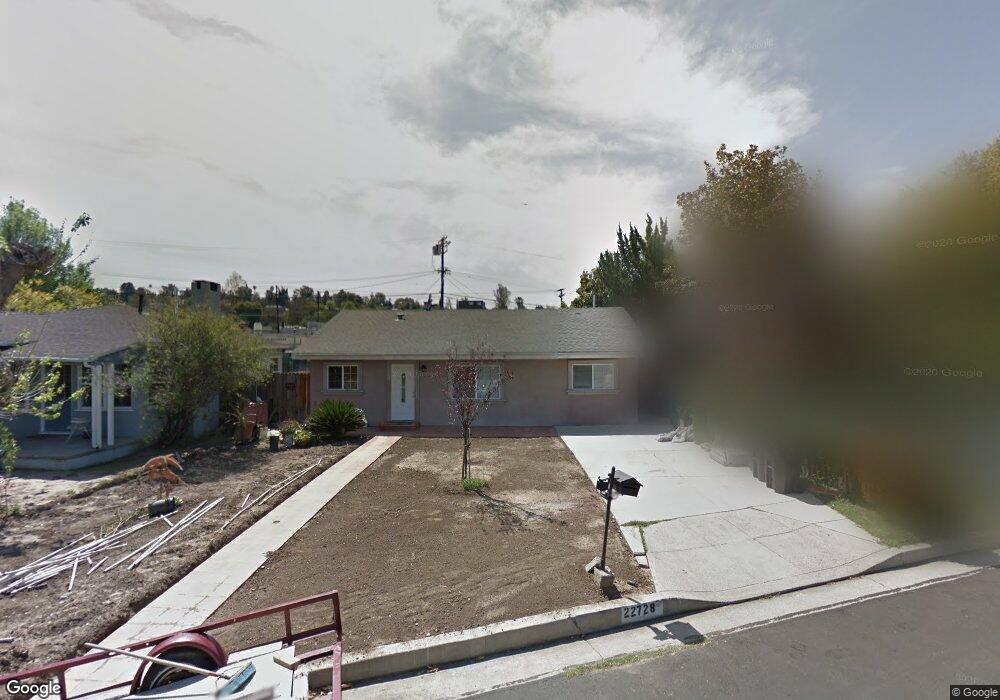
22728 Leonora Dr Woodland Hills, CA 91367
Estimated Value: $944,000 - $1,179,000
4
Beds
2
Baths
1,290
Sq Ft
$803/Sq Ft
Est. Value
About This Home
This home is located at 22728 Leonora Dr, Woodland Hills, CA 91367 and is currently estimated at $1,036,302, approximately $803 per square foot. 22728 Leonora Dr is a home located in Los Angeles County with nearby schools including Woodlake Elementary Community Charter, Woodland Hills Elementary Charter For Enriched Studies, and Hamlin Charter Academy.
Ownership History
Date
Name
Owned For
Owner Type
Purchase Details
Closed on
Apr 7, 1999
Sold by
Matejka George
Bought by
Hernandez Gil S and Serrano Anastacio
Current Estimated Value
Home Financials for this Owner
Home Financials are based on the most recent Mortgage that was taken out on this home.
Original Mortgage
$148,200
Outstanding Balance
$37,152
Interest Rate
6.92%
Estimated Equity
$999,150
Purchase Details
Closed on
Oct 24, 1997
Sold by
Gressman Gloria J
Bought by
Matejka George
Home Financials for this Owner
Home Financials are based on the most recent Mortgage that was taken out on this home.
Original Mortgage
$144,632
Interest Rate
7.26%
Mortgage Type
FHA
Purchase Details
Closed on
Dec 13, 1993
Sold by
Bickmann Laurence
Bought by
Gressman Gloria J
Home Financials for this Owner
Home Financials are based on the most recent Mortgage that was taken out on this home.
Original Mortgage
$98,400
Interest Rate
7%
Create a Home Valuation Report for This Property
The Home Valuation Report is an in-depth analysis detailing your home's value as well as a comparison with similar homes in the area
Home Values in the Area
Average Home Value in this Area
Purchase History
| Date | Buyer | Sale Price | Title Company |
|---|---|---|---|
| Hernandez Gil S | $156,000 | Chicago Title | |
| Matejka George | $147,000 | Chicago Title | |
| Gressman Gloria J | $123,000 | First American Title Company |
Source: Public Records
Mortgage History
| Date | Status | Borrower | Loan Amount |
|---|---|---|---|
| Open | Hernandez Gil S | $148,200 | |
| Previous Owner | Matejka George | $144,632 | |
| Previous Owner | Gressman Gloria J | $98,400 |
Source: Public Records
Tax History Compared to Growth
Tax History
| Year | Tax Paid | Tax Assessment Tax Assessment Total Assessment is a certain percentage of the fair market value that is determined by local assessors to be the total taxable value of land and additions on the property. | Land | Improvement |
|---|---|---|---|---|
| 2025 | $7,004 | $572,372 | $391,897 | $180,475 |
| 2024 | $7,004 | $561,150 | $384,213 | $176,937 |
| 2023 | $6,870 | $550,148 | $376,680 | $173,468 |
| 2022 | $6,552 | $539,362 | $369,295 | $170,067 |
| 2021 | $6,471 | $528,787 | $362,054 | $166,733 |
| 2019 | $6,279 | $513,105 | $351,316 | $161,789 |
| 2018 | $6,184 | $503,045 | $344,428 | $158,617 |
| 2016 | $5,907 | $483,512 | $331,054 | $152,458 |
| 2015 | $5,821 | $476,250 | $326,082 | $150,168 |
| 2014 | $5,846 | $466,922 | $319,695 | $147,227 |
Source: Public Records
Map
Nearby Homes
- 5350 Fallbrook Ave
- 22723 Leonora Dr
- 22809 Del Valle St Unit 8
- 5201 Rigoletto St
- 22642 Berdon St
- 22633 Crespi St
- 22963 Ostronic Dr
- 5550 Fallbrook Ave
- 23003 Mariano St
- 22931 Dolorosa St
- 22449 Cass Ave
- 23042 Ostronic Dr
- 22542 Burbank Blvd
- 22942 Crespi St
- 23110 Canzonet St
- 22910 Collins St
- 4933 Bruges Ave
- 4941 Rigoletto St
- 23143 Leonora Dr
- 22284 Avenue San Luis
- 22722 Leonora Dr
- 22738 Leonora Dr
- 22718 Leonora Dr
- 22740 Leonora Dr
- 22712 Leonora Dr
- 22725 Ventura Blvd Unit C
- 22725 Ventura Blvd
- 22731 Ventura Blvd
- 22735 Leonora Dr
- 22729 Leonora Dr
- 22743 Leonora Dr
- 22739 Leonora Dr
- 22725 Leonora Dr
- 22708 Leonora Dr
- 22717 Leonora Dr
- 5340 Fallbrook Ave
- 22753 Ventura Blvd
- 22702 Leonora Dr
- 5354 Fallbrook Ave
- 22711 Leonora Dr