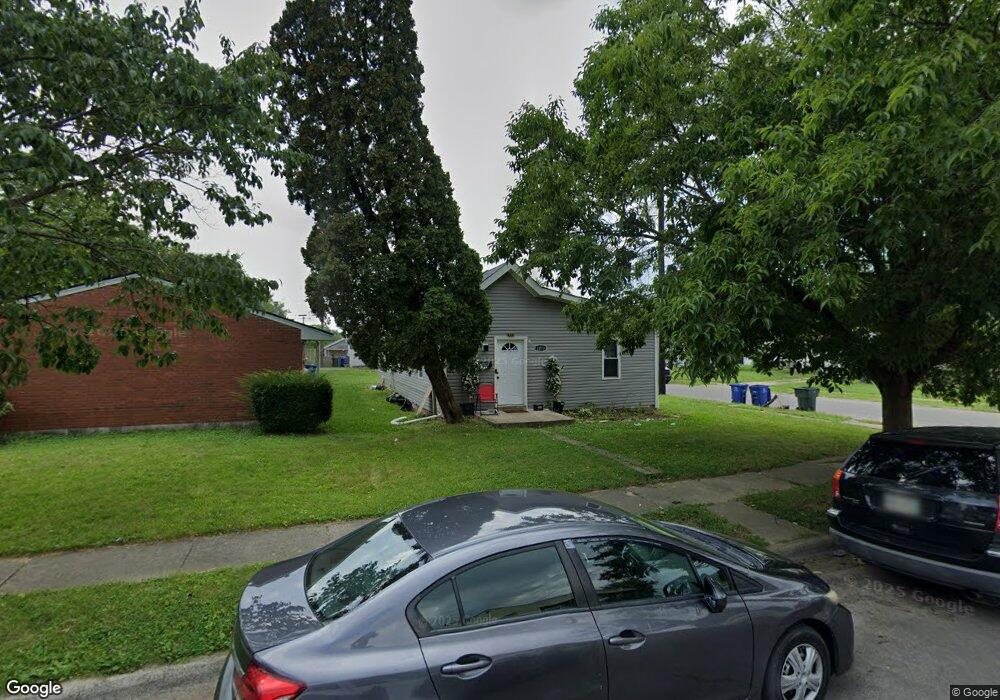
2273 Amherst Ave Columbus, OH 43223
South Central Hilltop NeighborhoodEstimated Value: $110,000 - $147,000
2
Beds
1
Bath
1,047
Sq Ft
$124/Sq Ft
Est. Value
About This Home
This home is located at 2273 Amherst Ave, Columbus, OH 43223 and is currently estimated at $130,221, approximately $124 per square foot. 2273 Amherst Ave is a home located in Franklin County with nearby schools including West Mound Elementary School, Hilltonia Middle School, and Briggs High School.
Ownership History
Date
Name
Owned For
Owner Type
Purchase Details
Closed on
Jun 14, 2019
Sold by
Tackett Ricky
Bought by
Etc Cust
Current Estimated Value
Purchase Details
Closed on
Jun 5, 2014
Sold by
Salamony Michael and Salamony Michael L
Bought by
Tackett Ricky
Purchase Details
Closed on
Nov 14, 2007
Sold by
Pontius Phyllis J
Bought by
Salamony Joan A
Purchase Details
Closed on
Oct 11, 2007
Sold by
Estate Of Donald H Pontius
Bought by
Pontius Phyllis J
Purchase Details
Closed on
Aug 28, 2007
Sold by
Estate Of Catherine A Pontius
Bought by
Pontius Donald H and Salamony Joan A
Purchase Details
Closed on
May 4, 2007
Sold by
Pontius Donald H and Salamony Joan A
Bought by
Salamony Joan A
Purchase Details
Closed on
Dec 2, 1988
Bought by
Pontius Donald H Tr and Salamony Joan A Tr
Purchase Details
Closed on
Sep 27, 1965
Bought by
Pontius Howard E
Create a Home Valuation Report for This Property
The Home Valuation Report is an in-depth analysis detailing your home's value as well as a comparison with similar homes in the area
Home Values in the Area
Average Home Value in this Area
Purchase History
| Date | Buyer | Sale Price | Title Company |
|---|---|---|---|
| Etc Cust | $7,300 | World Class Title Agcy Of Oh | |
| Tackett Ricky | $11,000 | None Available | |
| Salamony Joan A | -- | Attorney | |
| Pontius Phyllis J | -- | None Available | |
| Pontius Donald H | -- | None Available | |
| Salamony Joan A | -- | None Available | |
| Pontius Donald H Tr | -- | -- | |
| Pontius Howard E | $5,500 | -- |
Source: Public Records
Tax History Compared to Growth
Tax History
| Year | Tax Paid | Tax Assessment Tax Assessment Total Assessment is a certain percentage of the fair market value that is determined by local assessors to be the total taxable value of land and additions on the property. | Land | Improvement |
|---|---|---|---|---|
| 2024 | $1,347 | $29,400 | $5,250 | $24,150 |
| 2023 | $1,334 | $29,470 | $5,250 | $24,220 |
| 2022 | $434 | $8,160 | $1,890 | $6,270 |
| 2021 | $434 | $8,160 | $1,890 | $6,270 |
| 2020 | $464 | $8,160 | $1,890 | $6,270 |
| 2019 | $302 | $6,830 | $1,580 | $5,250 |
| 2018 | $245 | $6,830 | $1,580 | $5,250 |
| 2017 | $287 | $6,830 | $1,580 | $5,250 |
| 2016 | $666 | $7,210 | $3,850 | $3,360 |
| 2015 | $434 | $7,210 | $3,850 | $3,360 |
| 2014 | $447 | $7,210 | $3,850 | $3,360 |
| 2013 | $309 | $8,470 | $4,515 | $3,955 |
Source: Public Records
Map
Nearby Homes
- 545-547 S Highland Ave Unit 545
- 2188 Amherst Ave
- 2169 Amherst Ave
- 558 S Oakley Ave Unit 60
- 611 Whitethorne Ave
- 599 Whitethorne Ave
- 693 S Wayne Ave
- 2205-2207 Sullivant Ave
- 640 S Eureka Ave
- 2397 Sullivant Ave
- 724 S Eureka Ave
- 509 Belvidere Ave
- 2264 Shelton St
- 485 Belvidere Ave
- 379 Midland Ave
- 651 S Terrace Ave
- 353 Clarendon Ave
- 784-786 Butler Ave
- 453 S Eureka Ave
- 426 S Eureka Ave
- 2267 Amherst Ave Unit 269
- 2261 Amherst Ave
- 2257 Amherst Ave
- 2270 Safford Ave
- 621 S Highland Ave
- 2266 Safford Ave
- 627 S Highland Ave
- 2260 Safford Ave
- 609 S Highland Ave
- 2274 Safford Ave
- 2274 Amherst Ave
- 2268 Safford Ave
- 2268 Amherst Ave
- 2254 Safford Ave
- 633 S Highland Ave
- 2262 Amherst Ave Unit 264
- 2247 Amherst Ave
- 2250 Safford Ave
- 2254 Amherst Ave
- 2280 Safford Ave