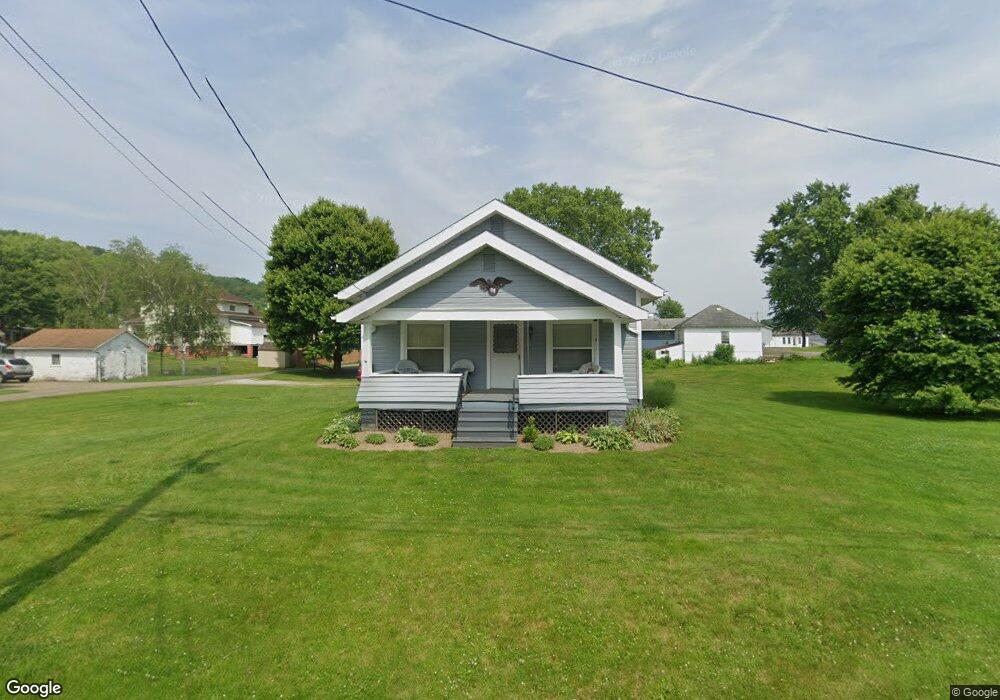
2273 Main St Midvale, OH 44653
Estimated Value: $110,000 - $148,000
3
Beds
2
Baths
1,680
Sq Ft
$78/Sq Ft
Est. Value
About This Home
This home is located at 2273 Main St, Midvale, OH 44653 and is currently estimated at $131,441, approximately $78 per square foot. 2273 Main St is a home located in Tuscarawas County with nearby schools including Midvale Elementary School, Tuscarawas Middle School, and Indian Valley High School.
Ownership History
Date
Name
Owned For
Owner Type
Purchase Details
Closed on
Dec 16, 2016
Sold by
Abel Lynzee M and Elmore Lynzee M
Bought by
Investment Source Ltd
Current Estimated Value
Purchase Details
Closed on
Dec 23, 2005
Sold by
Swinderman Sharon
Bought by
Elmore Lynzee M
Home Financials for this Owner
Home Financials are based on the most recent Mortgage that was taken out on this home.
Original Mortgage
$47,197
Interest Rate
6.4%
Mortgage Type
FHA
Create a Home Valuation Report for This Property
The Home Valuation Report is an in-depth analysis detailing your home's value as well as a comparison with similar homes in the area
Purchase History
| Date | Buyer | Sale Price | Title Company |
|---|---|---|---|
| Investment Source Ltd | $50,000 | None Available | |
| Elmore Lynzee M | $92,000 | Americas Choice Title Agency |
Source: Public Records
Mortgage History
| Date | Status | Borrower | Loan Amount |
|---|---|---|---|
| Previous Owner | Elmore Lynzee M | $47,197 |
Source: Public Records
Tax History
| Year | Tax Paid | Tax Assessment Tax Assessment Total Assessment is a certain percentage of the fair market value that is determined by local assessors to be the total taxable value of land and additions on the property. | Land | Improvement |
|---|---|---|---|---|
| 2024 | $1,139 | $92,420 | $8,800 | $83,620 |
| 2023 | $1,139 | $92,420 | $8,800 | $83,620 |
| 2022 | $1,148 | $32,347 | $3,080 | $29,267 |
| 2021 | $1,008 | $26,723 | $2,629 | $24,094 |
| 2020 | $1,019 | $26,723 | $2,629 | $24,094 |
| 2019 | $1,026 | $26,723 | $2,629 | $24,094 |
| 2018 | $917 | $22,560 | $2,220 | $20,340 |
| 2017 | $921 | $22,560 | $2,220 | $20,340 |
| 2016 | $945 | $22,560 | $2,220 | $20,340 |
| 2014 | $1,042 | $20,510 | $1,850 | $18,660 |
| 2013 | $1,016 | $20,510 | $1,850 | $18,660 |
Source: Public Records
Map
Nearby Homes
- 0 Ford Dr
- 2215 Hilliard Dr
- 2216 Hilliard Dr
- 4711 Broadway
- 0 Royal St
- 0 Vernon St Unit 5009296
- 11638 3rd St
- 2993 Brightwood Rd SE
- 1573 Barnhill Rd SE
- 0 Indian Hill Rd SE Unit 5190160
- 3912 Clay Ct SE
- 0 Canary Rd SE
- 5618 Green Ridge Rd SE
- 4095 Schumacher Hollow Rd SE
- 3183 Canary Rd SE
- 911 N Water St
- 213 Fuhr St
- 618 Parrish St
- 268 Schoenbrunn Dr NE
- 527 W 3rd St
- 2273 Main St Unit Rear
- 4580 Broadway St
- 4556 Broadway
- 4597 W State St
- 4597 E State St
- 2265 Main St
- 4580 Broadway
- 4651 Rutledge St
- 4590 Broadway St
- 4085 Apartment Dr
- 4653 Rutledge St
- 5221 Rutledge St SE
- 4557 Broadway St
- 2268 Main St
- 4549 E State St
- 4910 State St SE
- 4585 E State St
- 4577 Broadway St
- 4597 Broadway St
- 4614 Broadway St
Your Personal Tour Guide
Ask me questions while you tour the home.