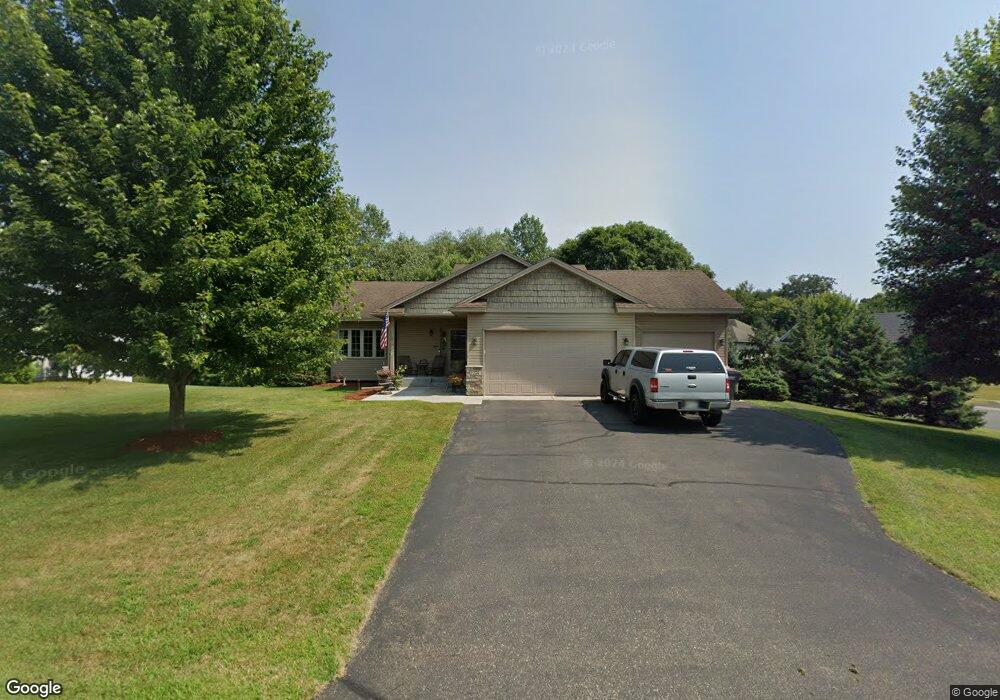
22743 22743 Rose Ct NW St. Francis, MN 55070
Estimated Value: $361,000 - $380,000
2
Beds
2
Baths
1,291
Sq Ft
$286/Sq Ft
Est. Value
About This Home
This home is located at 22743 22743 Rose Ct NW, St. Francis, MN 55070 and is currently estimated at $369,817, approximately $286 per square foot. 22743 22743 Rose Ct NW is a home located in Anoka County with nearby schools including St. Francis Elementary School, St. Francis Middle School, and St. Francis High School.
Ownership History
Date
Name
Owned For
Owner Type
Purchase Details
Closed on
Jun 8, 2018
Sold by
Hennen Lee A and Hennen Verna F
Bought by
Pease Kenneth D and Pease Britt
Current Estimated Value
Home Financials for this Owner
Home Financials are based on the most recent Mortgage that was taken out on this home.
Original Mortgage
$219,655
Outstanding Balance
$190,390
Interest Rate
4.6%
Mortgage Type
VA
Estimated Equity
$179,427
Purchase Details
Closed on
May 12, 2014
Sold by
Hennen Lee A and Hennen Verna F
Bought by
Pease Kenneth D and Pease Britt L
Home Financials for this Owner
Home Financials are based on the most recent Mortgage that was taken out on this home.
Original Mortgage
$210,000
Interest Rate
4.41%
Mortgage Type
Seller Take Back
Purchase Details
Closed on
Apr 29, 2013
Sold by
Corr Michael J and Schalo Lori A
Bought by
Hennen Verna F and Hennen Lee A
Create a Home Valuation Report for This Property
The Home Valuation Report is an in-depth analysis detailing your home's value as well as a comparison with similar homes in the area
Home Values in the Area
Average Home Value in this Area
Purchase History
| Date | Buyer | Sale Price | Title Company |
|---|---|---|---|
| Pease Kenneth D | $210,000 | First American Mortgage Solu | |
| Pease Kenneth D | $210,000 | None Available | |
| Hennen Verna F | -- | None Available |
Source: Public Records
Mortgage History
| Date | Status | Borrower | Loan Amount |
|---|---|---|---|
| Open | Pease Kenneth D | $219,655 | |
| Previous Owner | Pease Kenneth D | $210,000 |
Source: Public Records
Tax History Compared to Growth
Tax History
| Year | Tax Paid | Tax Assessment Tax Assessment Total Assessment is a certain percentage of the fair market value that is determined by local assessors to be the total taxable value of land and additions on the property. | Land | Improvement |
|---|---|---|---|---|
| 2025 | $3,306 | $329,900 | $70,000 | $259,900 |
| 2024 | $3,306 | $317,900 | $54,000 | $263,900 |
| 2023 | $3,190 | $319,700 | $54,000 | $265,700 |
| 2022 | $2,809 | $326,600 | $48,000 | $278,600 |
| 2021 | $2,877 | $253,700 | $32,000 | $221,700 |
| 2020 | $2,711 | $241,100 | $29,600 | $211,500 |
| 2019 | $2,402 | $227,300 | $29,600 | $197,700 |
| 2018 | $2,328 | $204,800 | $0 | $0 |
| 2017 | $2,093 | $195,400 | $0 | $0 |
| 2016 | $2,114 | $167,700 | $0 | $0 |
| 2015 | $2,062 | $167,700 | $18,800 | $148,900 |
| 2014 | -- | $142,400 | $13,300 | $129,100 |
Source: Public Records
Map
Nearby Homes
- 3428 227th Ave NW
- 22560 Poppy St NW
- 22509 Tulip St NW
- 3518 Bridge St NW
- 3728 227th Ct NW
- 3662 225th Ln NW
- 3806 225th Ln NW
- 23037 Ambassador Blvd NW
- 22232 Xenia St NW
- 23247 Ambassador Blvd NW
- 23016 Eidelweiss St NW
- 23041 Eidelweiss St NW
- 4142 228th Ave NW
- 23057 Eidelweiss St NW
- 4149 228th Ave NW
- 23116 Eidelweiss St NW
- 383X 221st Ln NW
- 4201 Saint Francis Blvd NW
- 2747 230th Ct NW
- 2747 229th Ln NW
- 22743 Rose Ct NW
- 22759 Rose Ct NW
- 22767 Rose Ct NW
- 3468 227th Ave NW
- 22780 Rose Ct NW
- 3452 227th Ave NW
- 22766 Poppy St NW
- 22766 22766 Poppy-Street-nw
- 22766 22766 Poppy St NW
- 3440 227th Ave NW
- 3488 227th Ave NW
- 22780 Poppy St NW
- 3476 227th Ave NW
- 3491 227th Ave NW
- 22808 Rose Ct NW
- 3414 227th Ave NW
- 22799 Rose Ct NW
- 22792 Poppy St NW
- 22795 Silverod St NW
- 22795 22795 Silverod-Street-nw