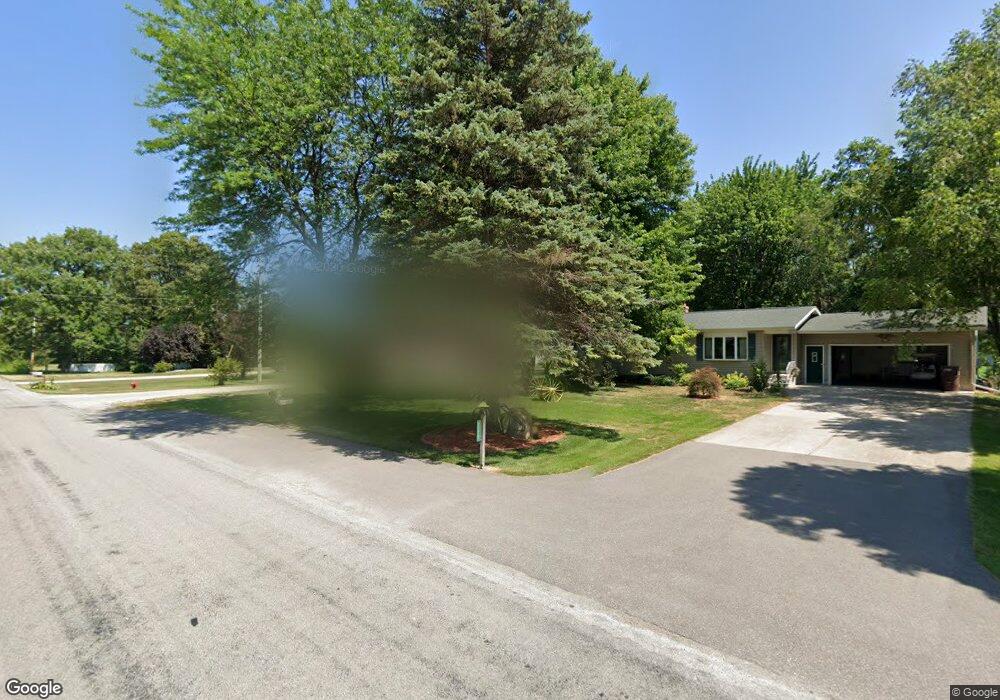
2275 Fraser Rd Kawkawlin, MI 48631
Estimated Value: $202,065 - $265,000
3
Beds
2
Baths
1,149
Sq Ft
$193/Sq Ft
Est. Value
About This Home
This home is located at 2275 Fraser Rd, Kawkawlin, MI 48631 and is currently estimated at $222,016, approximately $193 per square foot. 2275 Fraser Rd is a home located in Bay County with nearby schools including McAlear-Sawden Elementary School, Western Middle School, and Bay City Western High School.
Ownership History
Date
Name
Owned For
Owner Type
Purchase Details
Closed on
Oct 17, 2025
Sold by
Blohm Kevin R and Blohm Trust
Bought by
Robbins Chandler L and Robbins Meghan L
Current Estimated Value
Home Financials for this Owner
Home Financials are based on the most recent Mortgage that was taken out on this home.
Original Mortgage
$75,000
Outstanding Balance
$75,000
Interest Rate
5.6%
Mortgage Type
New Conventional
Estimated Equity
$147,016
Purchase Details
Closed on
Sep 3, 2025
Sold by
Blohm Trust and Zirul Diana L
Bought by
Blohm Kevin R
Home Financials for this Owner
Home Financials are based on the most recent Mortgage that was taken out on this home.
Original Mortgage
$75,000
Outstanding Balance
$75,000
Interest Rate
5.6%
Mortgage Type
New Conventional
Estimated Equity
$147,016
Purchase Details
Closed on
Dec 27, 2018
Sold by
Blohm Leona D and Blohm Alan R
Bought by
Blohm Leona D and The Blohm Trust
Create a Home Valuation Report for This Property
The Home Valuation Report is an in-depth analysis detailing your home's value as well as a comparison with similar homes in the area
Purchase History
| Date | Buyer | Sale Price | Title Company |
|---|---|---|---|
| Robbins Chandler L | $135,000 | None Listed On Document | |
| Blohm Kevin R | -- | None Listed On Document | |
| Blohm Leona D | -- | None Available |
Source: Public Records
Mortgage History
| Date | Status | Borrower | Loan Amount |
|---|---|---|---|
| Open | Robbins Chandler L | $75,000 |
Source: Public Records
Tax History
| Year | Tax Paid | Tax Assessment Tax Assessment Total Assessment is a certain percentage of the fair market value that is determined by local assessors to be the total taxable value of land and additions on the property. | Land | Improvement |
|---|---|---|---|---|
| 2025 | $2,408 | $98,600 | $0 | $0 |
| 2024 | $2,337 | $89,100 | $0 | $0 |
| 2023 | $2,225 | $72,300 | $0 | $0 |
| 2022 | $1,939 | $73,300 | $0 | $0 |
| 2021 | $1,795 | $62,650 | $62,650 | $0 |
| 2020 | $1,752 | $60,450 | $60,450 | $0 |
| 2019 | $1,691 | $57,550 | $0 | $0 |
| 2018 | $1,646 | $56,500 | $0 | $0 |
| 2017 | $1,615 | $57,300 | $0 | $0 |
| 2016 | $1,621 | $54,000 | $0 | $54,000 |
| 2015 | -- | $52,100 | $0 | $52,100 |
| 2014 | -- | $55,800 | $0 | $55,800 |
Source: Public Records
Map
Nearby Homes
- 661 E Beaver Rd
- 0 E River Rd
- 2439 Poplar Dr Unit 242
- 2406 Beech Dr
- 2430 4 Mile Rd
- 2401 Pajot Rd Unit 78
- 2409 Pajot Rd Unit 76
- 2481 Pajot Rd Unit 58
- 2437 Pajot Rd Unit 69
- 2407 8 Mile Rd Unit 19
- 000 Jose Rd
- 1943 S Huron Rd
- 439 Wheeler Rd
- 0 Fraser Rd Unit 50195526
- 2258 S Nine Mile Rd
- 780 S Mackinaw Rd
- 3760 7 Mile Rd
- 2148 Wheeler Rd
- 2418 Wetters Rd
- 0 S 8 Mile Unit 50196502
Your Personal Tour Guide
Ask me questions while you tour the home.