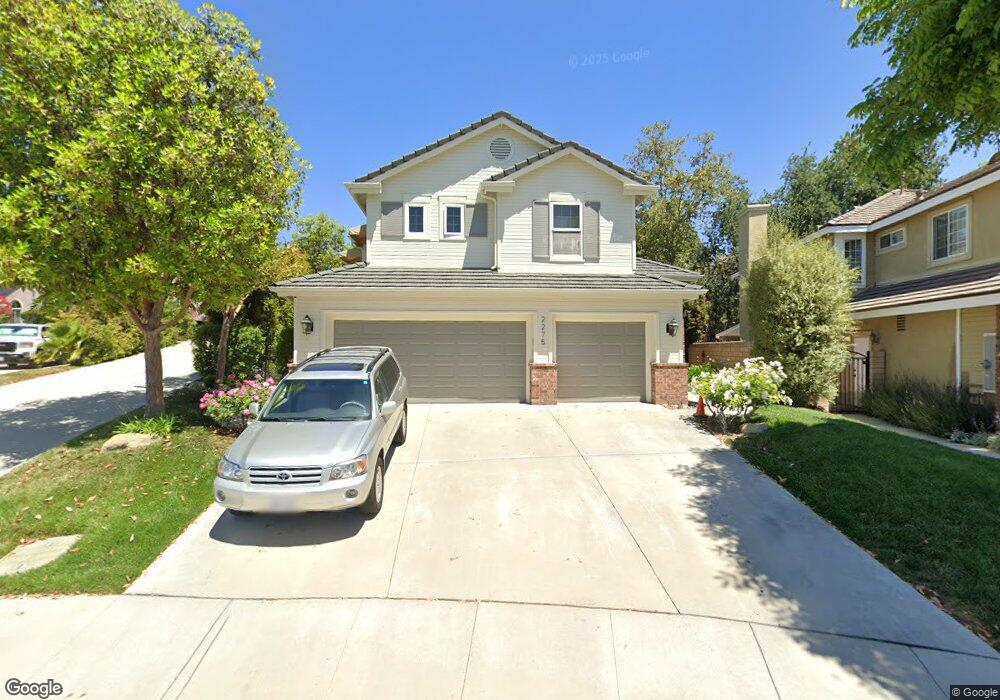
2275 Solway Ct Thousand Oaks, CA 91362
Estimated Value: $1,348,147 - $1,396,000
4
Beds
3
Baths
2,568
Sq Ft
$533/Sq Ft
Est. Value
About This Home
This home is located at 2275 Solway Ct, Thousand Oaks, CA 91362 and is currently estimated at $1,368,037, approximately $532 per square foot. 2275 Solway Ct is a home located in Ventura County with nearby schools including Lang Ranch, Los Cerritos Middle School, and Westlake High School.
Ownership History
Date
Name
Owned For
Owner Type
Purchase Details
Closed on
Feb 7, 2003
Sold by
Avery Mark and Avery Marcy
Bought by
Avery Mark and Avery Marcy
Current Estimated Value
Home Financials for this Owner
Home Financials are based on the most recent Mortgage that was taken out on this home.
Original Mortgage
$238,000
Interest Rate
5.16%
Purchase Details
Closed on
Aug 16, 2000
Sold by
Mark Avery
Bought by
Avery Mark and Avery Marcy
Purchase Details
Closed on
Jan 27, 1995
Sold by
Standard Pacific Corp
Bought by
Avery Mark and Avery Marcy
Home Financials for this Owner
Home Financials are based on the most recent Mortgage that was taken out on this home.
Original Mortgage
$254,000
Interest Rate
9.21%
Create a Home Valuation Report for This Property
The Home Valuation Report is an in-depth analysis detailing your home's value as well as a comparison with similar homes in the area
Home Values in the Area
Average Home Value in this Area
Purchase History
| Date | Buyer | Sale Price | Title Company |
|---|---|---|---|
| Avery Mark | -- | Fidelity National Title Co | |
| Avery Mark | -- | Fidelity National Title Co | |
| Avery Mark | -- | -- | |
| Avery Mark | $318,000 | Chicago Title |
Source: Public Records
Mortgage History
| Date | Status | Borrower | Loan Amount |
|---|---|---|---|
| Closed | Avery Mark | $238,000 | |
| Closed | Avery Mark | $254,000 |
Source: Public Records
Tax History Compared to Growth
Tax History
| Year | Tax Paid | Tax Assessment Tax Assessment Total Assessment is a certain percentage of the fair market value that is determined by local assessors to be the total taxable value of land and additions on the property. | Land | Improvement |
|---|---|---|---|---|
| 2025 | $6,370 | $534,033 | $213,610 | $320,423 |
| 2024 | $6,370 | $523,562 | $209,421 | $314,141 |
| 2023 | $6,177 | $513,297 | $205,315 | $307,982 |
| 2022 | $6,052 | $503,233 | $201,289 | $301,944 |
| 2021 | $5,927 | $493,366 | $197,342 | $296,024 |
| 2020 | $5,490 | $488,309 | $195,319 | $292,990 |
| 2019 | $5,343 | $478,736 | $191,490 | $287,246 |
| 2018 | $5,230 | $469,350 | $187,736 | $281,614 |
| 2017 | $5,124 | $460,148 | $184,055 | $276,093 |
| 2016 | $5,143 | $451,127 | $180,447 | $270,680 |
| 2015 | $5,051 | $444,353 | $177,738 | $266,615 |
| 2014 | $4,975 | $435,651 | $174,257 | $261,394 |
Source: Public Records
Map
Nearby Homes
- 2311 Gillingham Cir
- 2347 Laurelwood Dr
- 2848 Bayham Cir
- 2321 Sunny Point St
- 3128 Casino Dr
- 3249 Springbrook St
- 2427 Springbrook St
- 2225 Calle Riscoso
- 2001 Brookfield Dr
- 2499 Springbrook St
- 3182 Toulouse Cir
- 3180 Versaille Ct
- 3240 Casino Dr
- 1825 Sweet Briar Place
- 2535 Rikkard Dr
- 2252 Northpark St
- 1914 Sunshine Ct
- 2847 Cedar Wood Place
- 3386 Montagne Way
- 1669 Woodside Dr
- 2281 Solway Ct
- 2269 Solway Ct
- 2263 Solway Ct
- 2290 Laurelwood Dr
- 2296 Laurelwood Dr
- 2287 Solway Ct
- 2286 Laurelwood Dr
- 2256 Solway Ct
- 2302 Laurelwood Dr
- 2280 Laurelwood Dr
- 2293 Solway Ct
- 2306 Laurelwood Dr
- 2250 Solway Ct
- 2312 Laurelwood Dr
- 2932 Irongate Place
- 2299 Solway Ct
- 2920 Irongate Place
- 2917 Evesham Ave
- 2944 Irongate Place
- 2914 Irongate Place