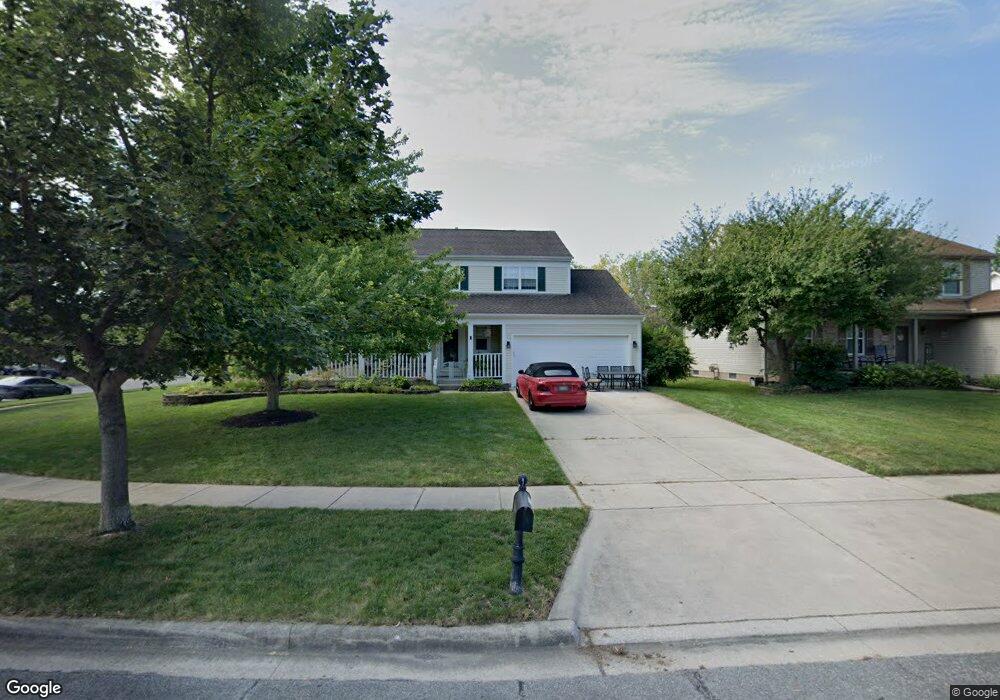
2275 Ziner Cir N Grove City, OH 43123
Estimated Value: $377,555 - $418,000
4
Beds
3
Baths
2,042
Sq Ft
$193/Sq Ft
Est. Value
About This Home
This home is located at 2275 Ziner Cir N, Grove City, OH 43123 and is currently estimated at $394,889, approximately $193 per square foot. 2275 Ziner Cir N is a home located in Franklin County with nearby schools including Monterey Elementary School, Park Street Intermediate School, and Grove City High School.
Ownership History
Date
Name
Owned For
Owner Type
Purchase Details
Closed on
May 31, 2002
Sold by
Feil Kenneth E and Feil Theresa L
Bought by
Tschertan Paul J and Tschertan Diane M
Current Estimated Value
Home Financials for this Owner
Home Financials are based on the most recent Mortgage that was taken out on this home.
Original Mortgage
$150,400
Outstanding Balance
$63,862
Interest Rate
6.87%
Mortgage Type
Purchase Money Mortgage
Estimated Equity
$331,027
Purchase Details
Closed on
Dec 4, 1996
Sold by
Sovereign Dev Corp
Bought by
Feil Kenneth E and Feil Theresa L
Home Financials for this Owner
Home Financials are based on the most recent Mortgage that was taken out on this home.
Original Mortgage
$141,950
Interest Rate
7%
Mortgage Type
New Conventional
Purchase Details
Closed on
Aug 22, 1996
Sold by
Pizzuti Equities Inc
Bought by
Sovereign Dev Corp
Create a Home Valuation Report for This Property
The Home Valuation Report is an in-depth analysis detailing your home's value as well as a comparison with similar homes in the area
Home Values in the Area
Average Home Value in this Area
Purchase History
| Date | Buyer | Sale Price | Title Company |
|---|---|---|---|
| Tschertan Paul J | $177,000 | Amerititle Mill Run | |
| Feil Kenneth E | $149,445 | -- | |
| Sovereign Dev Corp | $23,500 | -- |
Source: Public Records
Mortgage History
| Date | Status | Borrower | Loan Amount |
|---|---|---|---|
| Open | Tschertan Paul J | $150,400 | |
| Closed | Feil Kenneth E | $141,950 |
Source: Public Records
Tax History Compared to Growth
Tax History
| Year | Tax Paid | Tax Assessment Tax Assessment Total Assessment is a certain percentage of the fair market value that is determined by local assessors to be the total taxable value of land and additions on the property. | Land | Improvement |
|---|---|---|---|---|
| 2024 | $5,308 | $116,730 | $30,980 | $85,750 |
| 2023 | $5,233 | $116,725 | $30,975 | $85,750 |
| 2022 | $4,653 | $76,300 | $14,700 | $61,600 |
| 2021 | $4,743 | $76,300 | $14,700 | $61,600 |
| 2020 | $4,727 | $76,300 | $14,700 | $61,600 |
| 2019 | $4,193 | $62,790 | $12,250 | $50,540 |
| 2018 | $4,132 | $62,790 | $12,250 | $50,540 |
| 2017 | $4,123 | $62,790 | $12,250 | $50,540 |
| 2016 | $4,084 | $56,350 | $11,480 | $44,870 |
| 2015 | $4,085 | $56,350 | $11,480 | $44,870 |
| 2014 | $4,088 | $56,350 | $11,480 | $44,870 |
| 2013 | $1,930 | $56,350 | $11,480 | $44,870 |
Source: Public Records
Map
Nearby Homes
- 2300 Ziner Cir N
- 3400 Marshrun Dr
- 3378 Josephine Cir
- 3343 Marshrun Dr
- 2421 Yates Ave
- 2430 Sportsman Dr
- 3542 Hoover Rd
- 3333 Tareyton Dr
- 2545 Scott Ct
- 3201 Parkview Cir
- 2571 Scott Ct
- 3187 Parkview Cir Unit 3187
- 1892 Farmbrook Cir S
- 3474 Highland St
- 1948 Farmbrook Cir S Unit 7
- 1962 Farmbrook Cir N Unit 6
- 3140 Catan Loop Unit 3140
- 3815 Queen Anne Place Unit B19
- 3828 Queen Anne Place Unit B8
- 3153 Scenic Way
- 2303 Ziner Cir N
- 2292 Ziner Cir S
- 2308 Ziner Cir S
- 2313 Ziner Cir N
- 2270 Ziner Cir N
- 2262 Ziner Cir N
- 2318 Ziner Cir S
- 2290 Ziner Cir N
- 0 N Ziner Cir Unit 62 9718905
- 0 N Ziner Cir Unit 13 9718902
- 0 N Ziner Cir Unit 65 9718906
- 0 N Ziner Cir Unit 64 9710358
- 0 N Ziner Cir Unit 11 9710353
- 0 N Ziner Cir Unit 62 9822636
- 0 N Ziner Cir Unit L 15
- 2310 Ziner Cir N
- 2280 Ziner Cir N
- 0 N Ziner Cir Unit L 73
- 2323 Ziner Cir N
- 2252 Ziner Cir N