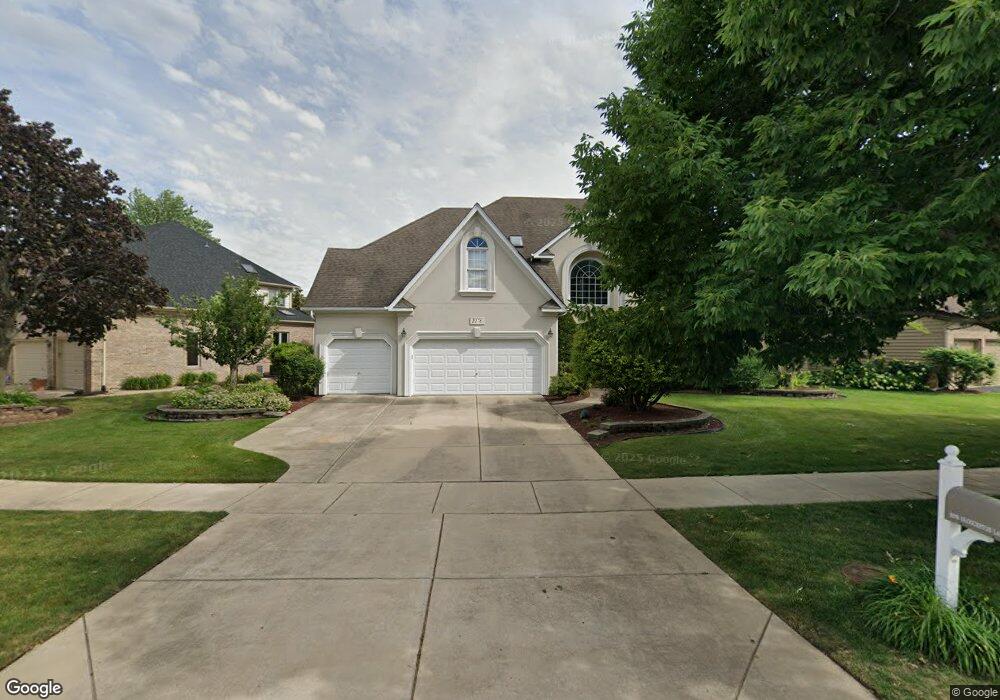
2276 Glouceston Ln Naperville, IL 60564
Stillwater NeighborhoodEstimated Value: $966,000 - $1,005,000
4
Beds
4
Baths
4,717
Sq Ft
$209/Sq Ft
Est. Value
About This Home
This home is located at 2276 Glouceston Ln, Naperville, IL 60564 and is currently estimated at $983,824, approximately $208 per square foot. 2276 Glouceston Ln is a home located in Will County with nearby schools including Williamsfield Elementary School, Welch Elementary School, and Ellsworth Elementary School.
Ownership History
Date
Name
Owned For
Owner Type
Purchase Details
Closed on
Mar 24, 2006
Sold by
Jakala Russell and Jakala Michal Lynn
Bought by
Au Kwok Keung and Chen Yin Hsiu
Current Estimated Value
Home Financials for this Owner
Home Financials are based on the most recent Mortgage that was taken out on this home.
Original Mortgage
$417,000
Outstanding Balance
$238,031
Interest Rate
6.34%
Mortgage Type
Fannie Mae Freddie Mac
Estimated Equity
$745,793
Purchase Details
Closed on
Oct 30, 1997
Sold by
Oliver Hoffman Corp
Bought by
Simmons Stephen R and Simmons Elaine B
Home Financials for this Owner
Home Financials are based on the most recent Mortgage that was taken out on this home.
Original Mortgage
$321,330
Interest Rate
7.24%
Create a Home Valuation Report for This Property
The Home Valuation Report is an in-depth analysis detailing your home's value as well as a comparison with similar homes in the area
Home Values in the Area
Average Home Value in this Area
Purchase History
| Date | Buyer | Sale Price | Title Company |
|---|---|---|---|
| Au Kwok Keung | $592,000 | Stewart Title Company | |
| Simmons Stephen R | $357,500 | Chicago Title Insurance Co |
Source: Public Records
Mortgage History
| Date | Status | Borrower | Loan Amount |
|---|---|---|---|
| Open | Au Kwok Keung | $417,000 | |
| Previous Owner | Simmons Stephen R | $321,330 |
Source: Public Records
Tax History Compared to Growth
Tax History
| Year | Tax Paid | Tax Assessment Tax Assessment Total Assessment is a certain percentage of the fair market value that is determined by local assessors to be the total taxable value of land and additions on the property. | Land | Improvement |
|---|---|---|---|---|
| 2024 | $19,435 | $304,724 | $72,166 | $232,558 |
| 2023 | $19,435 | $269,191 | $63,751 | $205,440 |
| 2022 | $18,564 | $254,650 | $60,307 | $194,343 |
| 2021 | $17,229 | $242,524 | $57,435 | $185,089 |
| 2020 | $16,905 | $238,681 | $56,525 | $182,156 |
| 2019 | $16,621 | $231,954 | $54,932 | $177,022 |
| 2018 | $16,433 | $225,373 | $53,724 | $171,649 |
| 2017 | $16,187 | $219,555 | $52,337 | $167,218 |
| 2016 | $16,162 | $214,828 | $51,210 | $163,618 |
| 2015 | $13,346 | $206,565 | $49,240 | $157,325 |
| 2014 | $13,346 | $165,588 | $49,240 | $116,348 |
| 2013 | $13,346 | $165,588 | $49,240 | $116,348 |
Source: Public Records
Map
Nearby Homes
- 2543 Dewes Ln
- 2736 Bluewater Cir
- 2611 Cedar Glade Dr Unit 204
- 2207 Sisters Ave
- 28W555 Leverenz Rd
- 2511 Sheehan Dr Unit 203
- 2220 Waterleaf Ct Unit 204
- 2227 Waterleaf Ct Unit 203
- 2866 Stonewater Dr Unit 102
- 2636 Salix Cir
- 2301 Mecan Dr
- 1329 Neskola Ct
- 1321 Galena Ct
- 2949 Brossman St
- 1305 Morningstar Ct Unit 1A
- 4284 Stableford Ln
- 1512 Harbour Towne Place
- 3311 Fairmont Ave
- 4258 Stableford Ln
- 3316 Club Ct
- 2280 Glouceston Ln
- 2268 Glouceston Ln
- 2288 Glouceston Ln
- 2264 Glouceston Ln
- 2307 New Haven Ct
- 2303 New Haven Ct
- 2275 Glouceston Ln
- 2271 Glouceston Ln
- 2279 Glouceston Ln
- 2315 Hillsboro Ln
- 2267 Glouceston Ln
- 2260 Glouceston Ln
- 2283 Glouceston Ln Unit 4
- 2319 Hillsboro Ln
- 2263 Glouceston Ln
- 2311 New Haven Ct
- 2287 Glouceston Ln
- 2304 New Haven Ct
- 2291 Glouceston Ln
- 2256 Glouceston Ln