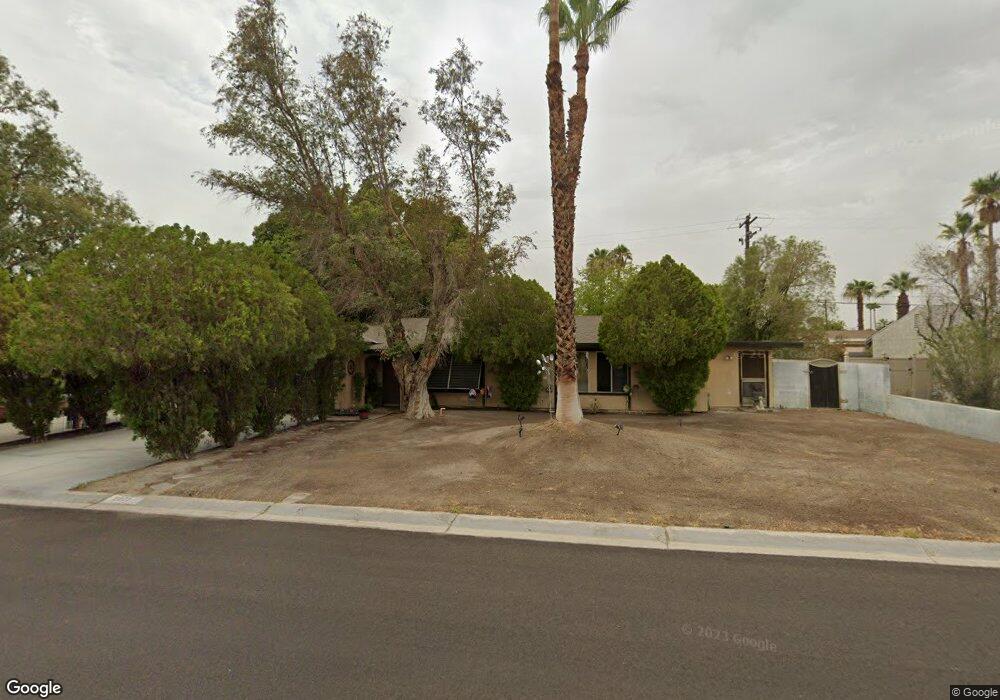
2277 N San Gorgonio Rd Palm Springs, CA 92262
Gene Autry NeighborhoodEstimated Value: $476,611 - $790,000
3
Beds
2
Baths
1,260
Sq Ft
$466/Sq Ft
Est. Value
About This Home
This home is located at 2277 N San Gorgonio Rd, Palm Springs, CA 92262 and is currently estimated at $587,403, approximately $466 per square foot. 2277 N San Gorgonio Rd is a home located in Riverside County with nearby schools including Vista Del Monte Elementary School, Raymond Cree Middle School, and Palm Springs High School.
Ownership History
Date
Name
Owned For
Owner Type
Purchase Details
Closed on
Aug 16, 2024
Sold by
Shaw Vester Harold
Bought by
Vester H Shaw Revocable Trust and Shaw
Current Estimated Value
Purchase Details
Closed on
Aug 25, 2003
Sold by
Shaw Ruby N
Bought by
Shaw Ruby N and Shaw Vestor Harold
Home Financials for this Owner
Home Financials are based on the most recent Mortgage that was taken out on this home.
Original Mortgage
$62,720
Interest Rate
5.87%
Mortgage Type
Purchase Money Mortgage
Purchase Details
Closed on
Aug 22, 2003
Sold by
Shaw Ruby Nadine and Shaw Vester Harold
Bought by
Shaw Ruby N
Home Financials for this Owner
Home Financials are based on the most recent Mortgage that was taken out on this home.
Original Mortgage
$62,720
Interest Rate
5.87%
Mortgage Type
Purchase Money Mortgage
Purchase Details
Closed on
Jul 15, 2003
Sold by
Shaw Ruby Nadine
Bought by
Shaw Ruby Nadine and Shaw Vester Harold
Home Financials for this Owner
Home Financials are based on the most recent Mortgage that was taken out on this home.
Original Mortgage
$62,720
Interest Rate
5.87%
Mortgage Type
Purchase Money Mortgage
Create a Home Valuation Report for This Property
The Home Valuation Report is an in-depth analysis detailing your home's value as well as a comparison with similar homes in the area
Home Values in the Area
Average Home Value in this Area
Purchase History
| Date | Buyer | Sale Price | Title Company |
|---|---|---|---|
| Vester H Shaw Revocable Trust | -- | None Listed On Document | |
| Shaw Ruby N | -- | Equity Title Company | |
| Shaw Ruby N | -- | -- | |
| Shaw Ruby Nadine | -- | -- |
Source: Public Records
Mortgage History
| Date | Status | Borrower | Loan Amount |
|---|---|---|---|
| Previous Owner | Shaw Ruby N | $62,720 |
Source: Public Records
Tax History Compared to Growth
Tax History
| Year | Tax Paid | Tax Assessment Tax Assessment Total Assessment is a certain percentage of the fair market value that is determined by local assessors to be the total taxable value of land and additions on the property. | Land | Improvement |
|---|---|---|---|---|
| 2025 | $1,970 | $188,730 | $47,845 | $140,885 |
| 2023 | $1,970 | $144,170 | $37,320 | $106,850 |
| 2022 | $2,002 | $141,344 | $36,589 | $104,755 |
| 2021 | $1,964 | $138,573 | $35,872 | $102,701 |
| 2020 | $1,884 | $137,153 | $35,505 | $101,648 |
| 2019 | $1,853 | $134,464 | $34,809 | $99,655 |
| 2018 | $1,820 | $131,828 | $34,127 | $97,701 |
| 2017 | $1,793 | $129,244 | $33,458 | $95,786 |
| 2016 | $1,744 | $126,710 | $32,802 | $93,908 |
| 2015 | $1,661 | $124,809 | $32,310 | $92,499 |
| 2014 | $1,623 | $122,366 | $31,678 | $90,688 |
Source: Public Records
Map
Nearby Homes
- 2888 E Venetia Rd
- 2380 N San Antonio Rd
- 2230 N Volturno Rd
- 3045 E Verona Rd
- 2864 E Valencia Rd
- 2825 E Verona Rd
- 3060 E Verona Rd
- 3121 E Ventura Rd
- 2770 E Ventura Rd
- 2901 E Via Escuela
- 2665 E Vincentia Rd
- 3190 E Vincentia Rd
- 2537 N Whitewater Club Dr Unit C
- 2521 N Whitewater Club Dr
- 2522 N Whitewater Club Dr Unit D
- 2521 N Whitewater Club Dr Unit A
- 2530 N Whitewater Club Dr Unit D
- 2504 N Whitewater Club Dr Unit A
- 2788 E Via Escuela
- 2643 E Venetia Rd
- 2352 N Volturno Rd
- 2255 N San Gorgonio Rd
- 2281 N San Gorgonio Rd
- 2290 N Volturno Rd
- 2380 N Volturno Rd
- 2334 N San Gorgonio Rd
- 2342 N San Gorgonio
- 2342 N San Gorgonio Rd
- 2300 N San Gorgonio Rd
- 2354 N San Gorgonio Rd
- 2251 N San Gorgonio Rd
- 2395 N San Gorgonio Rd
- 2256 N Volturno Rd
- 2390 N Volturno Rd
- 2270 N San Gorgonio Rd
- 2335 N San Antonio Rd
- 2895 E Venetia Rd
- 2375 N San Antonio Rd
- 2295 N San Antonio Rd
- 2898 E Venetia Rd