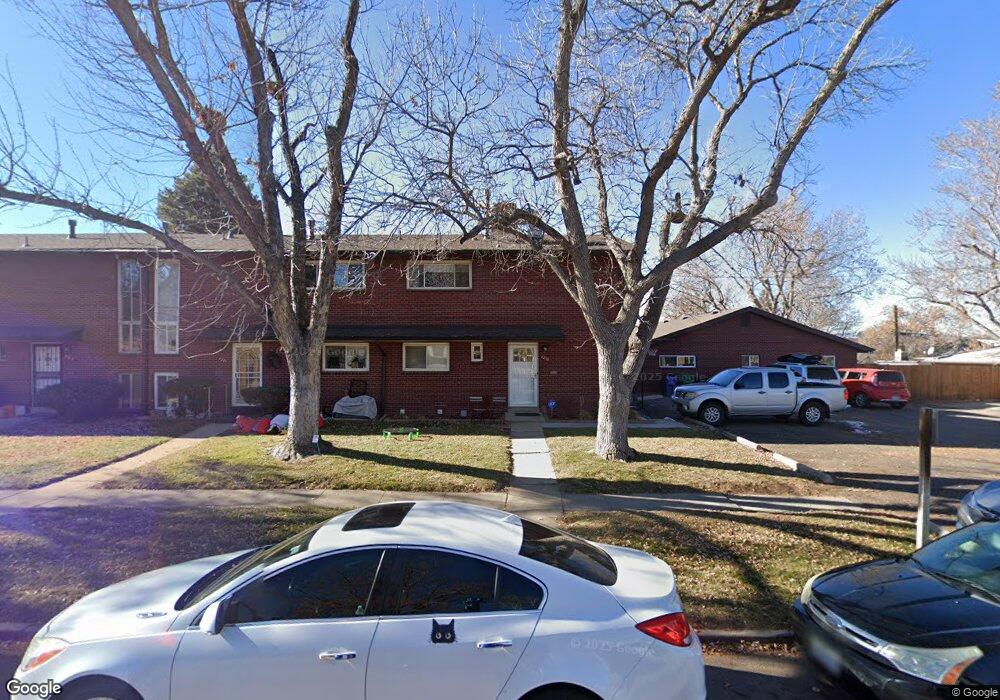
2279 S Grant St Unit A2279 Denver, CO 80210
Rosedale NeighborhoodEstimated Value: $479,000 - $566,000
4
Beds
3
Baths
1,974
Sq Ft
$263/Sq Ft
Est. Value
About This Home
This home is located at 2279 S Grant St Unit A2279, Denver, CO 80210 and is currently estimated at $519,367, approximately $263 per square foot. 2279 S Grant St Unit A2279 is a home located in Denver County with nearby schools including Asbury Elementary School, Grant Beacon Middle School, and South High School.
Ownership History
Date
Name
Owned For
Owner Type
Purchase Details
Closed on
Apr 26, 2010
Sold by
Tomeo Christopher and Tomeo Stephanie
Bought by
Louden Richard and Adamo Paula
Current Estimated Value
Home Financials for this Owner
Home Financials are based on the most recent Mortgage that was taken out on this home.
Original Mortgage
$197,040
Outstanding Balance
$131,159
Interest Rate
4.91%
Mortgage Type
New Conventional
Estimated Equity
$388,208
Purchase Details
Closed on
Sep 7, 2005
Sold by
Colangelo Robert J
Bought by
Hud
Purchase Details
Closed on
Oct 27, 1999
Sold by
Jacobs Earle W
Bought by
Colangelo Robert J
Home Financials for this Owner
Home Financials are based on the most recent Mortgage that was taken out on this home.
Original Mortgage
$146,200
Interest Rate
7.85%
Mortgage Type
FHA
Create a Home Valuation Report for This Property
The Home Valuation Report is an in-depth analysis detailing your home's value as well as a comparison with similar homes in the area
Home Values in the Area
Average Home Value in this Area
Purchase History
| Date | Buyer | Sale Price | Title Company |
|---|---|---|---|
| Louden Richard | $246,300 | Guardian Title | |
| Hud | $182,850 | -- | |
| Colangelo Robert J | $150,500 | First American Heritage Titl |
Source: Public Records
Mortgage History
| Date | Status | Borrower | Loan Amount |
|---|---|---|---|
| Open | Louden Richard | $197,040 | |
| Previous Owner | Colangelo Robert J | $146,200 |
Source: Public Records
Tax History Compared to Growth
Tax History
| Year | Tax Paid | Tax Assessment Tax Assessment Total Assessment is a certain percentage of the fair market value that is determined by local assessors to be the total taxable value of land and additions on the property. | Land | Improvement |
|---|---|---|---|---|
| 2024 | $1,902 | $24,020 | $6,160 | $17,860 |
| 2023 | $1,861 | $24,020 | $6,160 | $17,860 |
| 2022 | $1,936 | $24,340 | $10,220 | $14,120 |
| 2021 | $1,868 | $25,030 | $10,510 | $14,520 |
| 2020 | $1,890 | $25,470 | $7,690 | $17,780 |
| 2019 | $1,837 | $25,470 | $7,690 | $17,780 |
| 2018 | $1,785 | $23,070 | $5,700 | $17,370 |
| 2017 | $1,779 | $23,070 | $5,700 | $17,370 |
| 2016 | $1,634 | $20,040 | $5,851 | $14,189 |
| 2015 | $1,566 | $20,040 | $5,851 | $14,189 |
| 2014 | $1,350 | $16,260 | $4,999 | $11,261 |
Source: Public Records
Map
Nearby Homes
- 2275 S Grant St Unit E2275
- 2281 S Sherman St
- 2177 S Grant St
- 2194 S Sherman St
- 2174 S Sherman St Unit 2176
- 2163 S Grant St
- 2157 S Logan St
- 2345 S Lincoln St
- 2276 S Acoma St
- 2204 S Acoma St
- 2070 S Grant St
- 2082 S Lincoln St
- 2360 S Acoma St
- 2137 S Washington St
- 2143 S Acoma St
- 2034 S Lincoln St
- 2501 S Sherman St
- 2026 S Lincoln St
- 110 E Harvard Ave
- 31 W Evans Ave
- 2281 S Grant St
- 2283 S Grant St
- 2277 S Grant St Unit E2277
- 2285 S Grant St Unit A2285
- 2273 S Grant St Unit E2273
- 2271 S Grant St Unit E2271
- 2289 S Grant St
- 2287 S Grant St
- 2269 S Grant St Unit E2269
- 2291 S Grant St
- 2291 S Grant St Unit B2291
- 2248 S Grant St
- 2221 S Grant St Unit 2229
- 2258 S Grant St Unit 2266
- 2244 S Grant St
- 2293 S Grant St Unit B2293
- 2270 S Grant St
- 2270 S Grant St Unit 2280
- 2280 S Grant St
- 2284 S Sherman St