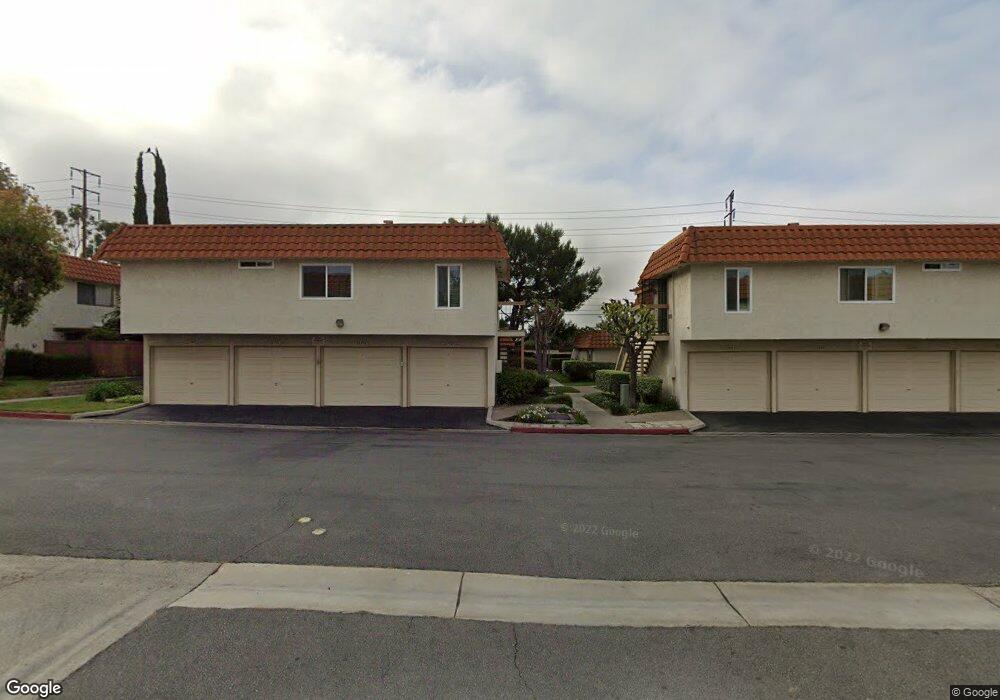
22796 Malaga Way Lake Forest, CA 92630
Estimated Value: $592,000 - $760,000
2
Beds
2
Baths
1,085
Sq Ft
$591/Sq Ft
Est. Value
About This Home
This home is located at 22796 Malaga Way, Lake Forest, CA 92630 and is currently estimated at $640,946, approximately $590 per square foot. 22796 Malaga Way is a home located in Orange County with nearby schools including Santiago STEAM Magnet Elementary School, Serrano Intermediate School, and El Toro High School.
Ownership History
Date
Name
Owned For
Owner Type
Purchase Details
Closed on
May 11, 2015
Sold by
Kala Sanjay Pukhraj and Kala Rita Sanjay
Bought by
The Kala Living Trust
Current Estimated Value
Purchase Details
Closed on
Mar 25, 1999
Sold by
Thomas Randy and Thomas Jean
Bought by
Kala Sanjay P and Kala Rita S
Home Financials for this Owner
Home Financials are based on the most recent Mortgage that was taken out on this home.
Original Mortgage
$102,000
Outstanding Balance
$25,425
Interest Rate
7.1%
Estimated Equity
$615,521
Purchase Details
Closed on
Oct 6, 1995
Sold by
Jones Kathryn A
Bought by
Thomas Randy and Thomas Jean
Home Financials for this Owner
Home Financials are based on the most recent Mortgage that was taken out on this home.
Original Mortgage
$89,200
Interest Rate
7.58%
Mortgage Type
FHA
Create a Home Valuation Report for This Property
The Home Valuation Report is an in-depth analysis detailing your home's value as well as a comparison with similar homes in the area
Home Values in the Area
Average Home Value in this Area
Purchase History
| Date | Buyer | Sale Price | Title Company |
|---|---|---|---|
| The Kala Living Trust | -- | None Available | |
| Kala Sanjay P | $127,500 | -- | |
| Thomas Randy | $91,500 | Guardian Title Company |
Source: Public Records
Mortgage History
| Date | Status | Borrower | Loan Amount |
|---|---|---|---|
| Open | Kala Sanjay P | $102,000 | |
| Previous Owner | Thomas Randy | $89,200 |
Source: Public Records
Tax History Compared to Growth
Tax History
| Year | Tax Paid | Tax Assessment Tax Assessment Total Assessment is a certain percentage of the fair market value that is determined by local assessors to be the total taxable value of land and additions on the property. | Land | Improvement |
|---|---|---|---|---|
| 2025 | $2,060 | $199,872 | $105,908 | $93,964 |
| 2024 | $2,060 | $195,953 | $103,831 | $92,122 |
| 2023 | $2,011 | $192,111 | $101,795 | $90,316 |
| 2022 | $1,976 | $188,345 | $99,799 | $88,546 |
| 2021 | $1,936 | $184,652 | $97,842 | $86,810 |
| 2020 | $1,919 | $182,759 | $96,839 | $85,920 |
| 2019 | $1,881 | $179,176 | $94,940 | $84,236 |
| 2018 | $1,846 | $175,663 | $93,078 | $82,585 |
| 2017 | $1,809 | $172,219 | $91,253 | $80,966 |
| 2016 | $1,780 | $168,843 | $89,464 | $79,379 |
| 2015 | $1,758 | $166,307 | $88,120 | $78,187 |
| 2014 | $1,720 | $163,050 | $86,394 | $76,656 |
Source: Public Records
Map
Nearby Homes
- 22718 Via Castilla
- 22862 Bonita Ln
- 22962 Springwater
- 25331 Via Viejo
- 22461 Silver Spur
- 25482 Coral Wood St
- 25614 Mont Pointe Unit 3D
- 22941 Belquest Dr
- 26025 Via Pera Unit J3
- 25496 Coral Wood St
- 26068 Via Pera
- 24841 Calle el Toro Grande
- 26158 Via Pera Unit E4
- 25644 Mont Pointe Unit 1A
- 24811 Calle el Toro Grande
- 133 Aliso Ridge Loop
- 23214 Orange Ave Unit 7
- 22556 Charwood Cir
- 23216 Orange Ave Unit 6
- 23220 Orange Ave Unit 2
- 22794 Malaga Way
- 22798 Malaga Way
- 22784 Malaga Way
- 22786 Malaga Way Unit 2
- 22782 Malaga Way
- 22806 Malaga Way Unit 2
- 22806 Malaga Way
- 22802 Malaga Way
- 22788 Malaga Way
- 22808 Malaga Way
- 22791 Malaga Way
- 22801 Malaga Way
- 22803 Malaga Way
- 22814 Malaga Way
- 22812 Malaga Way
- 22816 Malaga Way
- 22805 Malaga Way
- 22818 Malaga Way
- 22724 Via Castilla Unit 3
- 22807 Malaga Way