Estimated Value: $130,597 - $150,000
3
Beds
1
Bath
1,092
Sq Ft
$125/Sq Ft
Est. Value
About This Home
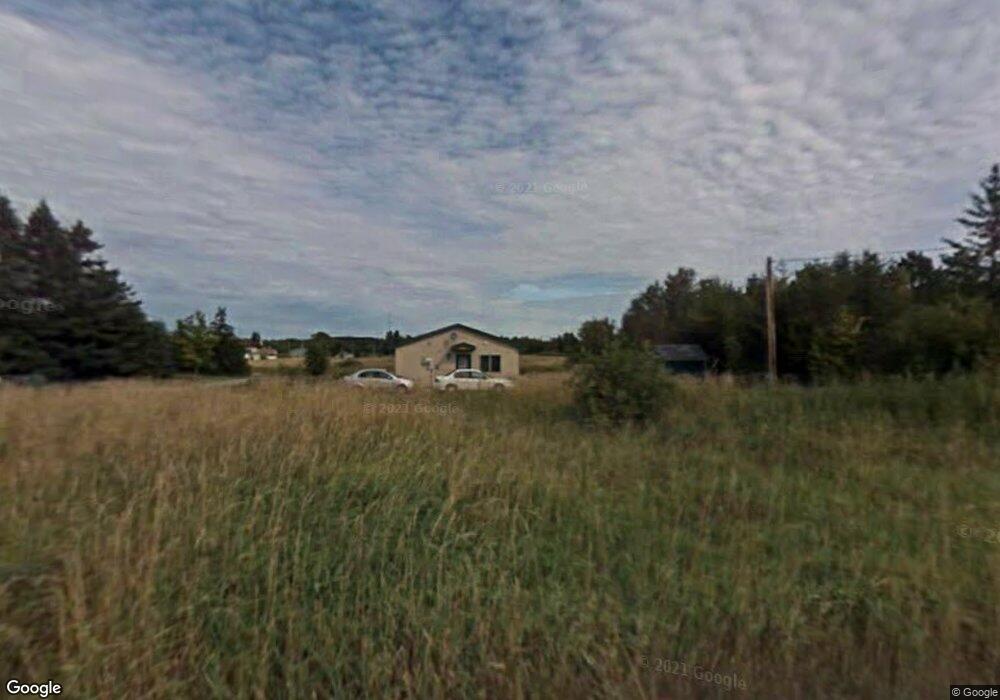
This home is located at 228 3rd Ave SE, Cook, MN 55723 and is currently estimated at $136,899, approximately $125 per square foot. 228 3rd Ave SE is a home located in St. Louis County with nearby schools including North Woods Elementary School.
Ownership History
Date
Name
Owned For
Owner Type
Purchase Details
Closed on
May 13, 2024
Sold by
Reing Daniel and Reing Ivette
Bought by
Mogensen Ryan Paul and Christensen Kylee Jo
Current Estimated Value
Home Financials for this Owner
Home Financials are based on the most recent Mortgage that was taken out on this home.
Original Mortgage
$18,000
Interest Rate
6.82%
Mortgage Type
New Conventional
Purchase Details
Closed on
Sep 8, 2016
Sold by
Jacka Sharon Ruth
Bought by
Reing Daniel and Reing Ivette
Home Financials for this Owner
Home Financials are based on the most recent Mortgage that was taken out on this home.
Original Mortgage
$87,300
Interest Rate
3.43%
Mortgage Type
New Conventional
Purchase Details
Closed on
Mar 15, 2007
Sold by
North St Louis County Habitat For Humani
Bought by
Jacka Sharon Ruth
Home Financials for this Owner
Home Financials are based on the most recent Mortgage that was taken out on this home.
Original Mortgage
$65,400
Interest Rate
6.19%
Mortgage Type
Seller Take Back
Create a Home Valuation Report for This Property
The Home Valuation Report is an in-depth analysis detailing your home's value as well as a comparison with similar homes in the area
Purchase History
| Date | Buyer | Sale Price | Title Company |
|---|---|---|---|
| Mogensen Ryan Paul | $123,000 | Northeast Title Company | |
| Reing Daniel | $90,000 | None Available | |
| Jacka Sharon Ruth | $100,000 | None Available |
Source: Public Records
Mortgage History
| Date | Status | Borrower | Loan Amount |
|---|---|---|---|
| Closed | Mogensen Ryan Paul | $18,000 | |
| Open | Mogensen Ryan Paul | $110,700 | |
| Previous Owner | Reing Daniel | $87,300 | |
| Previous Owner | Jacka Sharon Ruth | $65,400 |
Source: Public Records
Tax History
| Year | Tax Paid | Tax Assessment Tax Assessment Total Assessment is a certain percentage of the fair market value that is determined by local assessors to be the total taxable value of land and additions on the property. | Land | Improvement |
|---|---|---|---|---|
| 2024 | $1,116 | $111,000 | $7,500 | $103,500 |
| 2023 | $1,116 | $109,800 | $6,300 | $103,500 |
| 2022 | $1,228 | $92,500 | $6,300 | $86,200 |
| 2021 | $888 | $92,500 | $6,300 | $86,200 |
| 2020 | $816 | $75,200 | $6,300 | $68,900 |
| 2019 | $768 | $70,200 | $6,300 | $63,900 |
| 2018 | $726 | $70,200 | $6,300 | $63,900 |
| 2017 | $668 | $70,300 | $6,400 | $63,900 |
| 2016 | $712 | $63,000 | $6,400 | $56,600 |
| 2015 | $789 | $47,000 | $5,100 | $41,900 |
| 2014 | $789 | $47,000 | $5,100 | $41,900 |
Source: Public Records
Map
Nearby Homes
- Lot 3 Yahoo Point
- 1874 Johnson Rd
- 9774 Wien Rd
- Parcel 2 TBD Highway 115
- Parcel 8 TBD Highway 115
- Parcel 7 TBD Highway 115
- Parcel 10 TBD Highway 115
- Parcel 3 TBD Highway 115
- Parcel 13 TBD Highway 115
- 9849 Leander Rd
- Sec: 2 TWP: 61.0 RG:
- 9063 E Wakemup Village Rd
- 9141 Burghardt Rd
- 4090 N Arm W
- 0 Lake Vermilion Private Island and Mainland Boathou Unit NST6626410
- 8335 Boulder Ridge Rd
- Lake Vermilion Private Island and Mainland Boathouse
- XXX Lake Vermilion
- Lot 2 & Private Wakemup Narrows N
- Lot 2 & Private Isla Wakemup Narrows N
- 228 3rd St SE
- 306 3rd Ave SE
- 228 3rd St NW
- 219 3rd Ave SE
- 305 3rd Ave SE
- 210 3rd Ave SE
- 305 3rd Ave SE
- 213 3rd Ave SE
- 305 3rd St SE
- 95816 NW Pine Island
- 95810 NW Pine Island
- TBD Stone Ridge Rd
- 211 3rd Ave SE
- 224 2nd St SE
- 230 2nd St SE
- 214 2nd St SE
- 210 2nd St SE
- 210 210 2nd St SE
- 210 210 Se 2nd St
- 309 3rd St SE
Your Personal Tour Guide
Ask me questions while you tour the home.