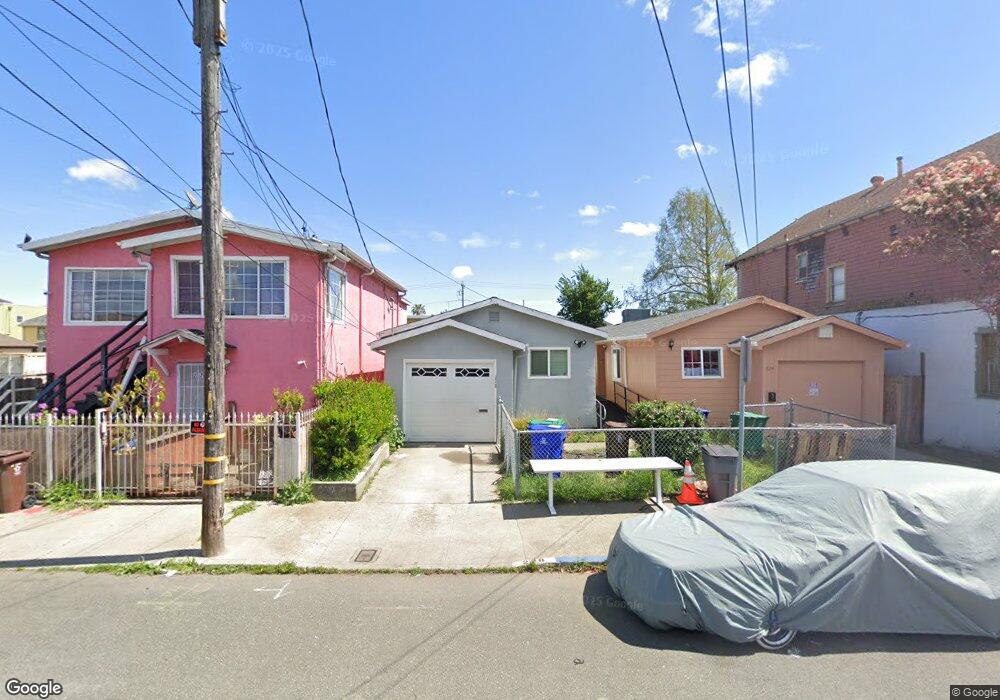
228 3rd St Richmond, CA 94801
Iron Triangle NeighborhoodEstimated Value: $535,973 - $595,000
4
Beds
2
Baths
1,247
Sq Ft
$449/Sq Ft
Est. Value
About This Home
This home is located at 228 3rd St, Richmond, CA 94801 and is currently estimated at $560,493, approximately $449 per square foot. 228 3rd St is a home located in Contra Costa County with nearby schools including Lincoln Elementary School, Lovonya DeJean Middle School, and John F. Kennedy High School.
Ownership History
Date
Name
Owned For
Owner Type
Purchase Details
Closed on
Jun 20, 2017
Sold by
Broadway Ivory B and Broadway Veronica L
Bought by
Broadway Ivory B and Broadway Veronica L
Current Estimated Value
Purchase Details
Closed on
Aug 6, 2015
Sold by
Broadway Veronica and Broadway Ivory
Bought by
Broadway Ivory
Home Financials for this Owner
Home Financials are based on the most recent Mortgage that was taken out on this home.
Original Mortgage
$405,000
Outstanding Balance
$312,337
Interest Rate
3.47%
Mortgage Type
Reverse Mortgage Home Equity Conversion Mortgage
Estimated Equity
$248,157
Purchase Details
Closed on
Mar 9, 2006
Sold by
Broadway Ivory B and Broadway Veronica L
Bought by
Broadway Ivory and Broadway Veronica
Home Financials for this Owner
Home Financials are based on the most recent Mortgage that was taken out on this home.
Original Mortgage
$270,000
Interest Rate
9.99%
Mortgage Type
Purchase Money Mortgage
Purchase Details
Closed on
Oct 31, 2000
Sold by
Jackson Jacklyn A
Bought by
Broadway Ivory B and Broadway Veronica L
Home Financials for this Owner
Home Financials are based on the most recent Mortgage that was taken out on this home.
Original Mortgage
$117,600
Interest Rate
8.87%
Mortgage Type
Purchase Money Mortgage
Purchase Details
Closed on
Dec 6, 1993
Sold by
Va
Bought by
Jackson Jacklyn A
Home Financials for this Owner
Home Financials are based on the most recent Mortgage that was taken out on this home.
Original Mortgage
$79,000
Interest Rate
6.89%
Mortgage Type
Purchase Money Mortgage
Create a Home Valuation Report for This Property
The Home Valuation Report is an in-depth analysis detailing your home's value as well as a comparison with similar homes in the area
Home Values in the Area
Average Home Value in this Area
Purchase History
| Date | Buyer | Sale Price | Title Company |
|---|---|---|---|
| Broadway Ivory B | -- | None Available | |
| Broadway Ivory | -- | Fidelity National Title Co | |
| Broadway Ivory | -- | Financial Title Company | |
| Broadway Ivory B | $147,000 | First American Title Guarant | |
| Jackson Jacklyn A | $1,000 | -- |
Source: Public Records
Mortgage History
| Date | Status | Borrower | Loan Amount |
|---|---|---|---|
| Open | Broadway Ivory | $405,000 | |
| Closed | Broadway Ivory | $270,000 | |
| Closed | Broadway Ivory B | $117,600 | |
| Previous Owner | Jackson Jacklyn A | $79,000 | |
| Closed | Broadway Ivory B | $29,400 |
Source: Public Records
Tax History Compared to Growth
Tax History
| Year | Tax Paid | Tax Assessment Tax Assessment Total Assessment is a certain percentage of the fair market value that is determined by local assessors to be the total taxable value of land and additions on the property. | Land | Improvement |
|---|---|---|---|---|
| 2025 | $4,660 | $221,479 | $42,252 | $179,227 |
| 2024 | $4,528 | $217,137 | $41,424 | $175,713 |
| 2023 | $4,528 | $212,880 | $40,612 | $172,268 |
| 2022 | $4,422 | $208,707 | $39,816 | $168,891 |
| 2021 | $4,350 | $204,616 | $39,036 | $165,580 |
| 2019 | $4,080 | $198,549 | $37,879 | $160,670 |
| 2018 | $3,932 | $194,657 | $37,137 | $157,520 |
| 2017 | $3,830 | $190,841 | $36,409 | $154,432 |
| 2016 | $3,758 | $187,100 | $35,696 | $151,404 |
| 2015 | $3,618 | $184,290 | $35,160 | $149,130 |
| 2014 | $3,452 | $171,500 | $32,720 | $138,780 |
Source: Public Records
Map
Nearby Homes