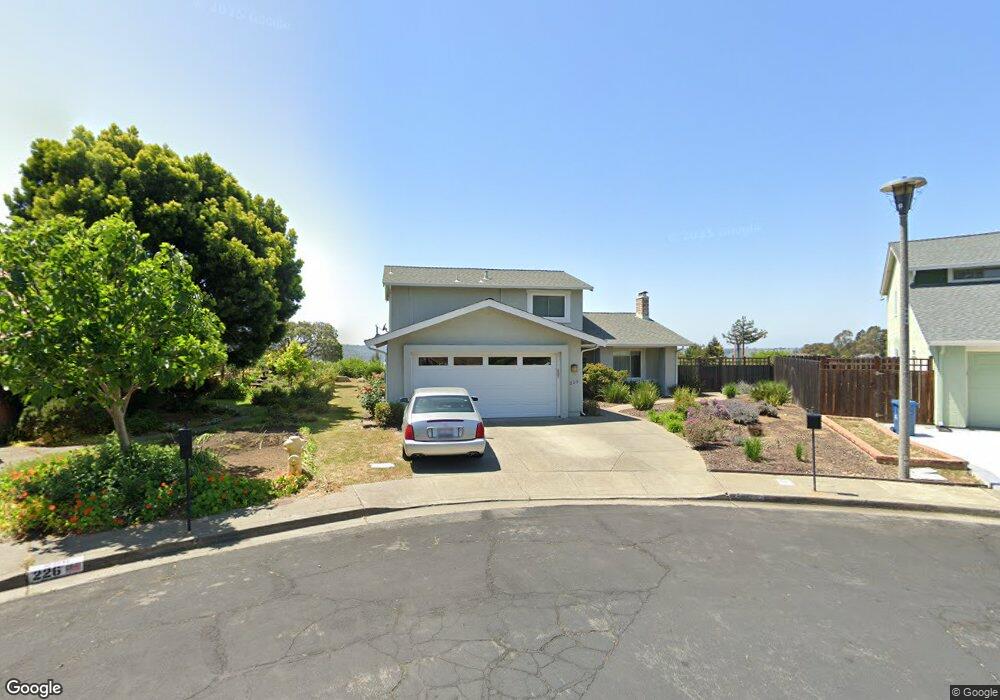
228 Chadwick Ct Benicia, CA 94510
Estimated Value: $810,000 - $1,098,000
4
Beds
3
Baths
1,874
Sq Ft
$495/Sq Ft
Est. Value
About This Home
This home is located at 228 Chadwick Ct, Benicia, CA 94510 and is currently estimated at $928,024, approximately $495 per square foot. 228 Chadwick Ct is a home located in Solano County with nearby schools including Joe Henderson Elementary School, Benicia Middle School, and Benicia High School.
Ownership History
Date
Name
Owned For
Owner Type
Purchase Details
Closed on
Apr 10, 2014
Sold by
Harmon Anne and Connor Alexandra
Bought by
The Richard D Keeley & Bonnie S Keeley 1 and Keeley Bonnie S
Current Estimated Value
Purchase Details
Closed on
Sep 2, 2009
Sold by
Gandek Patrice Mackaronis
Bought by
Harmon Anne and Connor Alexandra
Home Financials for this Owner
Home Financials are based on the most recent Mortgage that was taken out on this home.
Original Mortgage
$364,000
Interest Rate
5.25%
Mortgage Type
New Conventional
Create a Home Valuation Report for This Property
The Home Valuation Report is an in-depth analysis detailing your home's value as well as a comparison with similar homes in the area
Home Values in the Area
Average Home Value in this Area
Purchase History
| Date | Buyer | Sale Price | Title Company |
|---|---|---|---|
| The Richard D Keeley & Bonnie S Keeley 1 | $611,500 | Old Republic Title Company | |
| Harmon Anne | $455,000 | North American Title Company |
Source: Public Records
Mortgage History
| Date | Status | Borrower | Loan Amount |
|---|---|---|---|
| Previous Owner | Harmon Anne | $364,000 |
Source: Public Records
Tax History
| Year | Tax Paid | Tax Assessment Tax Assessment Total Assessment is a certain percentage of the fair market value that is determined by local assessors to be the total taxable value of land and additions on the property. | Land | Improvement |
|---|---|---|---|---|
| 2025 | $8,782 | $749,358 | $91,933 | $657,425 |
| 2024 | $8,782 | $734,666 | $90,131 | $644,535 |
| 2023 | $8,571 | $720,262 | $88,364 | $631,898 |
| 2022 | $8,411 | $706,140 | $86,633 | $619,507 |
| 2021 | $8,240 | $692,295 | $84,935 | $607,360 |
| 2020 | $8,131 | $685,198 | $84,065 | $601,133 |
| 2019 | $7,990 | $671,764 | $82,417 | $589,347 |
| 2018 | $7,786 | $658,593 | $80,801 | $577,792 |
| 2017 | $7,606 | $645,680 | $79,217 | $566,463 |
| 2016 | $7,674 | $633,020 | $77,664 | $555,356 |
| 2015 | $7,480 | $623,513 | $76,498 | $547,015 |
| 2014 | $5,635 | $473,000 | $71,000 | $402,000 |
Source: Public Records
Map
Nearby Homes
- 309 Drake Ct
- 900 Southampton Rd Unit 110
- 900 Southampton Rd Unit 2
- 900 Southampton Rd Unit 140
- 900 Southampton Rd Unit 24
- 900 Southampton Rd Unit 51
- 900 Southampton Rd
- 137 Chelsea Hills Dr
- 212 Eaton Ct
- 117 Sunset Cir Unit 36
- 565 Lori Dr Unit 80
- 565 Lori Dr Unit 58
- 100 Sunset Cir Unit 68
- 2016 Clearview Cir
- 2000 Clearview Cir
- 494 Mills Dr
- 403 Gerald Ct
- 138 Warwick Dr Unit 77
- 101 Panorama Dr
- 97 Carlisle Way
Your Personal Tour Guide
Ask me questions while you tour the home.