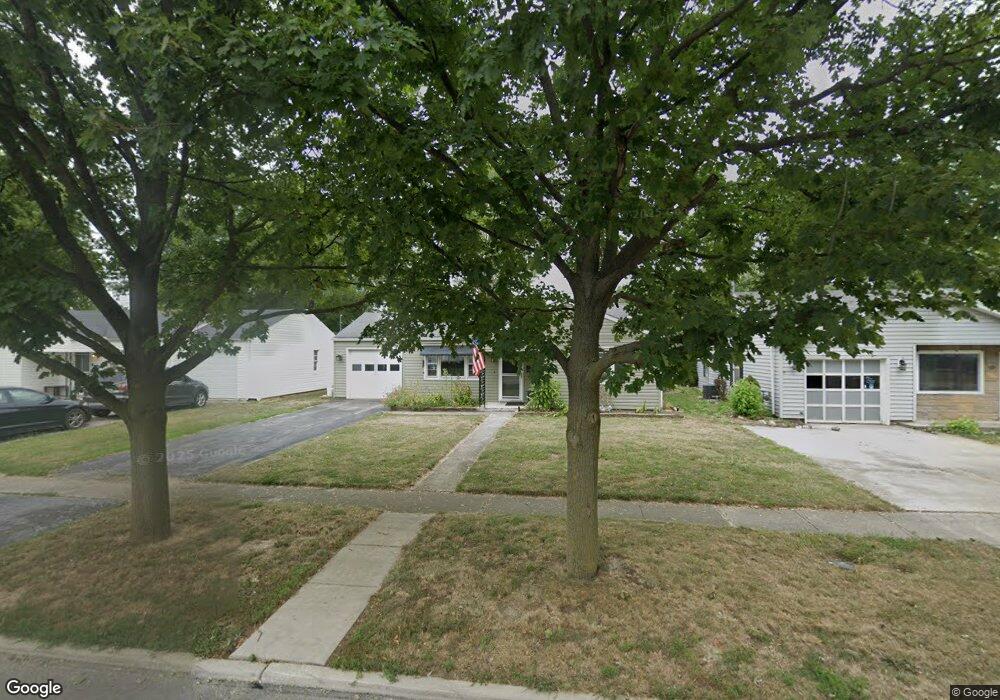
228 Clifton Ave Findlay, OH 45840
Estimated Value: $146,000 - $157,000
2
Beds
1
Bath
929
Sq Ft
$162/Sq Ft
Est. Value
About This Home
This home is located at 228 Clifton Ave, Findlay, OH 45840 and is currently estimated at $150,121, approximately $161 per square foot. 228 Clifton Ave is a home located in Hancock County with nearby schools including Northview Elementary School, Bigelow Hill Elementary School, and Glenwood Middle School.
Ownership History
Date
Name
Owned For
Owner Type
Purchase Details
Closed on
Dec 18, 2024
Sold by
Wohlgamuth Thomas L
Bought by
Shafer Jeffrey J
Current Estimated Value
Home Financials for this Owner
Home Financials are based on the most recent Mortgage that was taken out on this home.
Original Mortgage
$145,122
Interest Rate
6.93%
Mortgage Type
FHA
Purchase Details
Closed on
May 9, 2005
Sold by
Schneider David S
Bought by
Schneider David S and Schneider Daniel S
Purchase Details
Closed on
Jul 26, 1995
Sold by
Mccleave Robert
Bought by
Wohlgamuth Thomas
Home Financials for this Owner
Home Financials are based on the most recent Mortgage that was taken out on this home.
Original Mortgage
$37,000
Interest Rate
7.15%
Mortgage Type
New Conventional
Purchase Details
Closed on
Feb 16, 1990
Bought by
Mccleave Robert G
Create a Home Valuation Report for This Property
The Home Valuation Report is an in-depth analysis detailing your home's value as well as a comparison with similar homes in the area
Home Values in the Area
Average Home Value in this Area
Purchase History
| Date | Buyer | Sale Price | Title Company |
|---|---|---|---|
| Shafer Jeffrey J | $147,800 | Golden Key Title | |
| Shafer Jeffrey J | $147,800 | Golden Key Title | |
| Schneider David S | -- | Whitman Title | |
| Wohlgamuth Thomas | $55,500 | -- | |
| Mccleave Robert G | $40,000 | -- |
Source: Public Records
Mortgage History
| Date | Status | Borrower | Loan Amount |
|---|---|---|---|
| Previous Owner | Shafer Jeffrey J | $145,122 | |
| Previous Owner | Wohlgamuth Thomas | $37,000 |
Source: Public Records
Tax History Compared to Growth
Tax History
| Year | Tax Paid | Tax Assessment Tax Assessment Total Assessment is a certain percentage of the fair market value that is determined by local assessors to be the total taxable value of land and additions on the property. | Land | Improvement |
|---|---|---|---|---|
| 2024 | $1,172 | $32,990 | $4,830 | $28,160 |
| 2023 | $1,174 | $32,990 | $4,830 | $28,160 |
| 2022 | $1,170 | $32,990 | $4,830 | $28,160 |
| 2021 | $1,089 | $26,750 | $4,830 | $21,920 |
| 2020 | $1,089 | $26,750 | $4,830 | $21,920 |
| 2019 | $1,067 | $26,750 | $4,830 | $21,920 |
| 2018 | $1,019 | $23,450 | $4,390 | $19,060 |
| 2017 | $1,020 | $23,450 | $4,390 | $19,060 |
| 2016 | $1,015 | $23,450 | $4,390 | $19,060 |
| 2015 | $881 | $20,140 | $4,390 | $15,750 |
| 2014 | $881 | $20,140 | $4,390 | $15,750 |
| 2012 | $888 | $20,140 | $4,390 | $15,750 |
Source: Public Records
Map
Nearby Homes
- 304 Rector Ave
- 405 Clifton Ave
- 304 Prentiss Ave
- 410 Monroe Ave
- 1934 Geffs Ave
- 1820 N Main St
- 1825 Pershing St
- 643 Edith Ave
- 2100 Candlewick Dr
- 604 Davis St
- 533 Davis St
- 206 Midland Ave
- 230 Midland Ave
- 115 George St
- 334 E Foulke Ave
- 231 Tioga Ave
- 905 W Melrose Ave
- 420 Allen Ave
- 128 Harrington Ave
- 600 Charles Ave
- 224 Clifton Ave
- 232 Clifton Ave
- 234 Clifton Ave
- 216 Clifton Ave
- 255 Rector Ave
- 259 Rector Ave
- 249 Rector Ave
- 301 Rector Ave
- 245 Rector Ave
- 300 Clifton Ave
- 233 Clifton Ave
- 229 Clifton Ave
- 239 Rector Ave
- 237 Clifton Ave
- 303 Rector Ave
- 208 Clifton Ave
- 308 Clifton Ave
- 235 Rector Ave
- 225 Clifton Ave
- 219 Clifton Ave