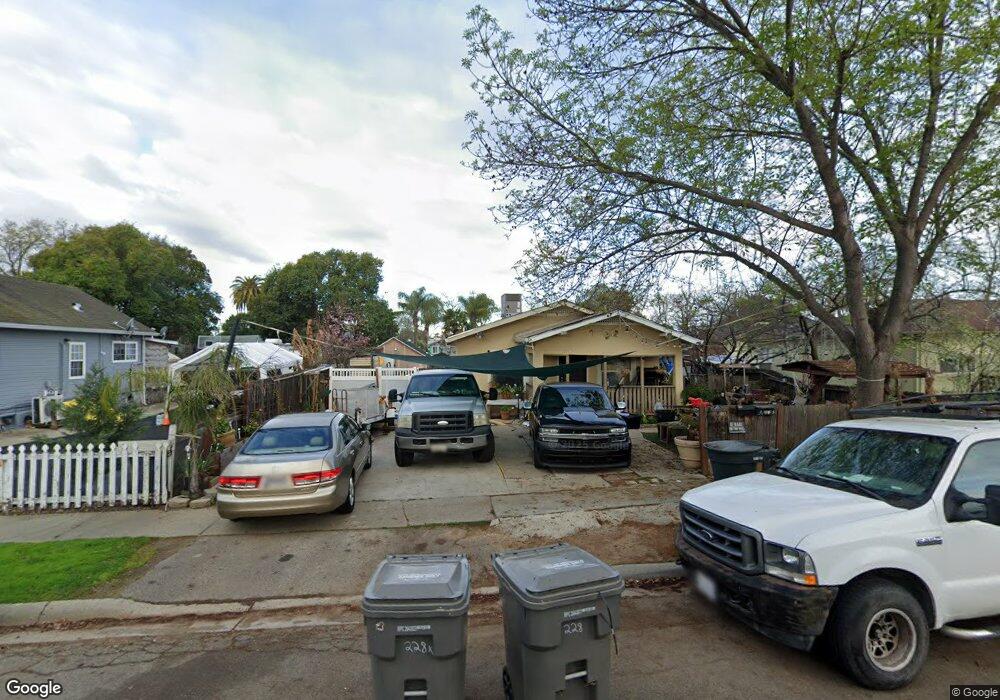
228 D St Roseville, CA 95678
Theiles Manor NeighborhoodEstimated Value: $438,108 - $707,000
2
Beds
1
Bath
1,752
Sq Ft
$327/Sq Ft
Est. Value
About This Home
This home is located at 228 D St, Roseville, CA 95678 and is currently estimated at $572,777, approximately $326 per square foot. 228 D St is a home located in Placer County with nearby schools including George Cirby Elementary School, Warren T. Eich Middle School, and Oakmont High School.
Ownership History
Date
Name
Owned For
Owner Type
Purchase Details
Closed on
Apr 20, 2021
Sold by
Stamas Gus and Stamas Mary E
Bought by
Stamas Gus I and Stamas Mary E
Current Estimated Value
Purchase Details
Closed on
Aug 30, 2016
Sold by
Stamas Immanuel S
Bought by
Stamas Manuel Sam and Stamas Haido Irene
Purchase Details
Closed on
Aug 4, 2008
Sold by
Stamas Peter S and Stamas Mary Anagnos
Bought by
Stamas I Peter Sam and Stamas Mary Anagnos
Purchase Details
Closed on
Jul 2, 2001
Sold by
Stamas Haido Irene
Bought by
Stamas Gus L and Stamas Mary E
Create a Home Valuation Report for This Property
The Home Valuation Report is an in-depth analysis detailing your home's value as well as a comparison with similar homes in the area
Home Values in the Area
Average Home Value in this Area
Purchase History
We collect this data history from publicly available records. To have your information removed, we recommend requesting removal directly through your county’s website.
| Date | Buyer | Sale Price | Title Company |
|---|---|---|---|
| Stamas Gus I | -- | None Available | |
| Stamas Manuel Sam | -- | None Available | |
| Stamas I Peter Sam | -- | None Available | |
| Stamas Gus L | -- | None Available |
Source: Public Records
Tax History
| Year | Tax Paid | Tax Assessment Tax Assessment Total Assessment is a certain percentage of the fair market value that is determined by local assessors to be the total taxable value of land and additions on the property. | Land | Improvement |
|---|---|---|---|---|
| 2025 | $3,375 | $327,958 | $83,661 | $244,297 |
| 2023 | $3,375 | $315,224 | $80,413 | $234,811 |
| 2022 | $3,322 | $309,044 | $78,837 | $230,207 |
| 2021 | $3,246 | $302,986 | $77,292 | $225,694 |
| 2020 | $3,236 | $299,880 | $76,500 | $223,380 |
| 2019 | $1,704 | $155,395 | $46,616 | $108,779 |
| 2018 | $2,145 | $200,214 | $54,112 | $146,102 |
| 2017 | $2,122 | $196,289 | $53,051 | $143,238 |
| 2016 | $2,138 | $192,441 | $52,011 | $140,430 |
| 2015 | $2,096 | $189,551 | $51,230 | $138,321 |
| 2014 | $2,064 | $185,839 | $50,227 | $135,612 |
Source: Public Records
Map
Nearby Homes
- 210 C St
- 502 Dudley Dr
- 610 Hernandez Ln
- 1342 Church St
- 217 Earl Ave
- 0 Bonita St
- 1675 Vernon St Unit 51
- 416 Milan Ct
- 137 Earl Ave
- 1110 Circuit Dr
- 1951 Ajay Dr
- 2000 Inglis Way Unit A
- 620 Darling Way
- 2054 Ajay Dr
- 930 Circuit Dr
- 123 Valley Oak Dr Unit 34
- 508 Douglas Blvd
- 128 Duranta St
- 223 Live Oak Cir Unit 62
- 104 Duncan Way
Your Personal Tour Guide
Ask me questions while you tour the home.