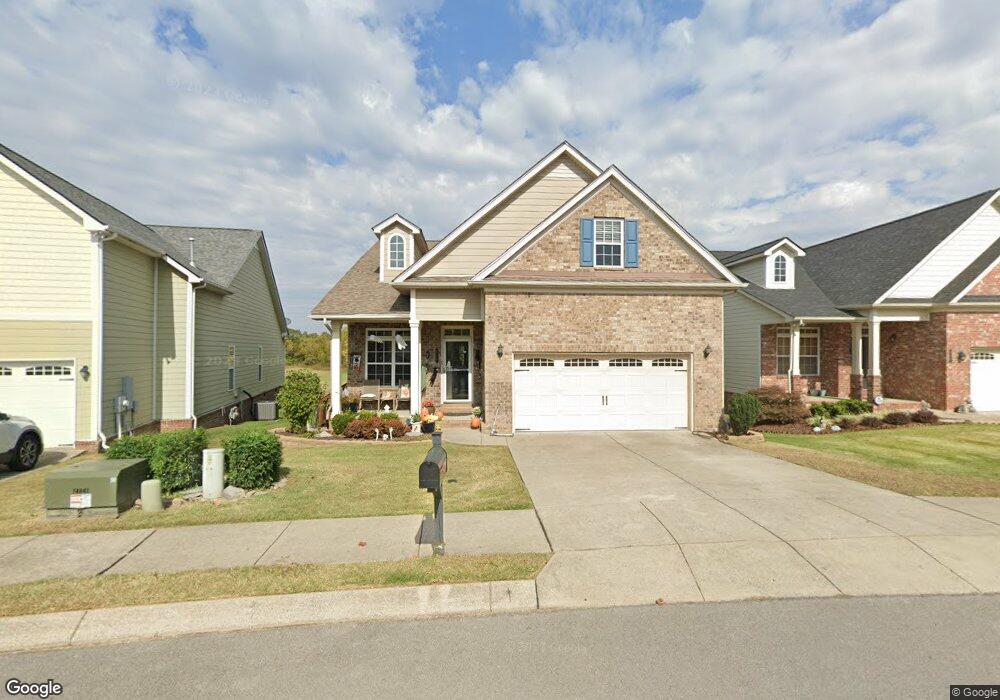
228 Dobson Branch Ct Nolensville, TN 37135
Estimated Value: $593,000 - $686,000
--
Bed
3
Baths
2,207
Sq Ft
$293/Sq Ft
Est. Value
About This Home
This home is located at 228 Dobson Branch Ct, Nolensville, TN 37135 and is currently estimated at $646,318, approximately $292 per square foot. 228 Dobson Branch Ct is a home located in Williamson County with nearby schools including Mill Creek Elementary School, Mill Creek Middle School, and Nolensville High School.
Ownership History
Date
Name
Owned For
Owner Type
Purchase Details
Closed on
Jun 23, 2025
Sold by
Bennett David and Bennett Guinevere
Bought by
Bennett Family Trust
Current Estimated Value
Purchase Details
Closed on
May 30, 2013
Sold by
Ellis Seward H and Ellis Ellen H
Bought by
Bennett Guinevere and Bennett David
Home Financials for this Owner
Home Financials are based on the most recent Mortgage that was taken out on this home.
Original Mortgage
$287,960
Interest Rate
3.43%
Mortgage Type
VA
Purchase Details
Closed on
Feb 22, 2012
Sold by
Ellis Seward and Ellis Ellen
Bought by
Ellis Seward H and Ellis Ellen H
Purchase Details
Closed on
Mar 14, 2011
Sold by
Gregory Robert H and Gregory Maureen D
Bought by
Ellis Seward and Ellis Ellen
Purchase Details
Closed on
May 5, 2006
Sold by
Westview Homes Llc
Bought by
Gregory Robert H and Gregory Maureen D
Purchase Details
Closed on
Dec 22, 2005
Sold by
Ck Development Llc
Bought by
Westview Homes Llc
Create a Home Valuation Report for This Property
The Home Valuation Report is an in-depth analysis detailing your home's value as well as a comparison with similar homes in the area
Home Values in the Area
Average Home Value in this Area
Purchase History
| Date | Buyer | Sale Price | Title Company |
|---|---|---|---|
| Bennett Family Trust | -- | None Listed On Document | |
| Bennett Guinevere | $281,900 | Tennesse Title Service Llc | |
| Ellis Seward H | -- | Foundation Title & Escrow Ll | |
| Ellis Seward | $272,500 | Foundation Title & Escrow Ll | |
| Gregory Robert H | $270,365 | Mooreland Title Company Llc | |
| Westview Homes Llc | $582,706 | Mooreland Title |
Source: Public Records
Mortgage History
| Date | Status | Borrower | Loan Amount |
|---|---|---|---|
| Previous Owner | Bennett Guinevere | $287,960 |
Source: Public Records
Tax History Compared to Growth
Tax History
| Year | Tax Paid | Tax Assessment Tax Assessment Total Assessment is a certain percentage of the fair market value that is determined by local assessors to be the total taxable value of land and additions on the property. | Land | Improvement |
|---|---|---|---|---|
| 2025 | $2,124 | $151,825 | $42,500 | $109,325 |
| 2024 | $2,124 | $97,875 | $21,250 | $76,625 |
| 2023 | $2,124 | $97,875 | $21,250 | $76,625 |
| 2022 | $2,124 | $97,875 | $21,250 | $76,625 |
| 2021 | $2,124 | $97,875 | $21,250 | $76,625 |
| 2020 | $1,948 | $77,600 | $16,250 | $61,350 |
| 2019 | $1,839 | $77,600 | $16,250 | $61,350 |
| 2018 | $1,784 | $77,600 | $16,250 | $61,350 |
| 2017 | $1,769 | $77,600 | $16,250 | $61,350 |
| 2016 | $0 | $76,125 | $16,250 | $59,875 |
| 2015 | -- | $65,075 | $13,750 | $51,325 |
| 2014 | -- | $65,075 | $13,750 | $51,325 |
Source: Public Records
Map
Nearby Homes
- 244 Siegert Place
- 208 Siegert Place
- 304 Thesing Ct
- 9918 Sam Donald Rd
- 5030 Maxwell Landing Dr
- 5028 Burke Trail
- 4800 Powder Springs Rd
- 4609 Van Leer Ct
- 6191 Christmas Dr
- 4528 Sawmill Place
- 404 Lively Way
- 136 Madison Mill Dr
- 4592 Sawmill Place
- 104 Lodge Hall Rd
- 2105 Sugar Mill Dr
- 3236 Bradfield Dr
- 813 Stonebrook Blvd
- 143 Lodge Hall Rd
- 1117 Millshed Dr
- 3027 Ash Dale Ln
- 232 Dobson Branch Ct
- 224 Dobson Branch Ct
- 236 Dobson Branch Ct
- 220 Dobson Branch Ct
- 240 Dobson Branch Ct
- 216 Dobson Branch Ct
- 240 Dobson Branch Trail
- 223 Dobson Branch Ct
- 212 Dobson Branch Ct
- 244 Dobson Branch Ct
- 209 Dobson Branch Ct
- 243 Dobson Branch Ct
- 208 Dobson Branch Ct
- 201 Dobson Branch Ct
- 247 Dobson Branch Ct
- 239 Dobson Branch Ct
- 204 Dobson Branch Ct
- 245 Siegert Place
- 256 Siegert Place
- 252 Siegert Place Unit 1614