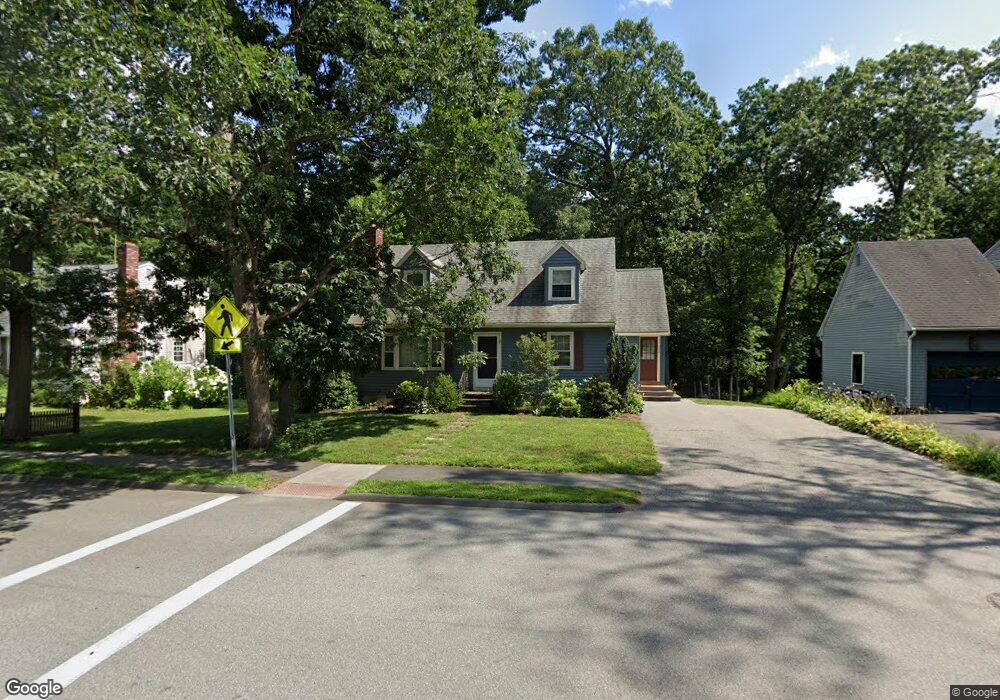
228 Forest St Reading, MA 01867
Estimated Value: $929,407 - $1,020,000
3
Beds
3
Baths
2,192
Sq Ft
$445/Sq Ft
Est. Value
About This Home
This home is located at 228 Forest St, Reading, MA 01867 and is currently estimated at $974,352, approximately $444 per square foot. 228 Forest St is a home located in Middlesex County with nearby schools including Birch Meadow Elementary School, Arthur W. Coolidge Middle School, and Reading Memorial High School.
Ownership History
Date
Name
Owned For
Owner Type
Purchase Details
Closed on
Oct 3, 2014
Sold by
Wyer David L and Wyer Denise D
Bought by
David L Wyer T L and David Wyer
Current Estimated Value
Purchase Details
Closed on
May 1, 1989
Sold by
Pichler John F
Bought by
Wyer David L
Purchase Details
Closed on
Nov 16, 1987
Sold by
Collins Michael J
Bought by
Pichler John F
Create a Home Valuation Report for This Property
The Home Valuation Report is an in-depth analysis detailing your home's value as well as a comparison with similar homes in the area
Home Values in the Area
Average Home Value in this Area
Purchase History
| Date | Buyer | Sale Price | Title Company |
|---|---|---|---|
| David L Wyer T L | -- | -- | |
| Wyer David L | $214,000 | -- | |
| Pichler John F | $205,000 | -- |
Source: Public Records
Mortgage History
| Date | Status | Borrower | Loan Amount |
|---|---|---|---|
| Previous Owner | Pichler John F | $88,000 | |
| Previous Owner | Pichler John F | $62,000 | |
| Previous Owner | Pichler John F | $130,000 | |
| Previous Owner | Pichler John F | $145,000 |
Source: Public Records
Tax History
| Year | Tax Paid | Tax Assessment Tax Assessment Total Assessment is a certain percentage of the fair market value that is determined by local assessors to be the total taxable value of land and additions on the property. | Land | Improvement |
|---|---|---|---|---|
| 2025 | $9,284 | $815,100 | $473,600 | $341,500 |
| 2024 | $9,177 | $783,000 | $455,000 | $328,000 |
| 2023 | $8,889 | $706,000 | $410,200 | $295,800 |
| 2022 | $8,555 | $641,800 | $372,900 | $268,900 |
| 2021 | $6,922 | $614,100 | $357,300 | $256,800 |
| 2020 | $8,152 | $584,400 | $340,000 | $244,400 |
| 2019 | $7,922 | $556,700 | $323,900 | $232,800 |
| 2018 | $5,097 | $521,800 | $305,500 | $216,300 |
| 2017 | $6,907 | $492,300 | $288,200 | $204,100 |
| 2016 | $6,657 | $459,100 | $258,200 | $200,900 |
| 2015 | $6,236 | $424,200 | $238,600 | $185,600 |
| 2014 | $6,042 | $409,900 | $230,500 | $179,400 |
Source: Public Records
Map
Nearby Homes
- 150 Grove St
- 115 Forest St
- 10 Meadow Brook Ln
- 119 Van Norden Rd
- 64 Longfellow Rd
- 35 Longfellow Rd
- 43 Ashley Place
- 89 Grand St
- 37 Fairchild Dr
- 863 Main St
- 430 West St
- 61 Beaver Rd
- 17 Courtyard Place Unit 17
- 52 Sanborn St Unit 7
- 45 Longview Rd
- 141 Johnson Woods Dr
- 5 Washington St Unit D4
- 319 West St
- 20 White Oaks Ln
- 30 Taylor Dr Unit 3011
Your Personal Tour Guide
Ask me questions while you tour the home.