228 Fremont St Battle Creek, MI 49017
Northeast Battle Creek NeighborhoodEstimated Value: $174,188 - $203,000
3
Beds
2
Baths
2,040
Sq Ft
$92/Sq Ft
Est. Value
About This Home
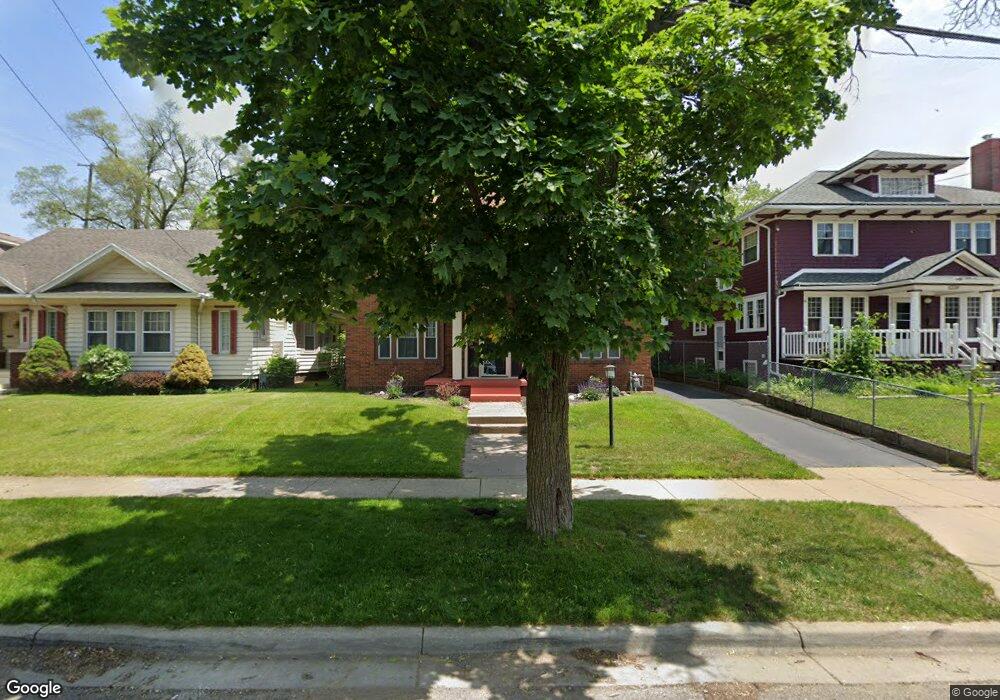
This home is located at 228 Fremont St, Battle Creek, MI 49017 and is currently estimated at $188,547, approximately $92 per square foot. 228 Fremont St is a home located in Calhoun County with nearby schools including Northwestern Middle School, Battle Creek Central High School, and St. Philip Catholic Central High School.
Ownership History
Date
Name
Owned For
Owner Type
Purchase Details
Closed on
Apr 29, 2005
Sold by
Mccomb Mark W and Nelson Mccomb Christine B
Bought by
Hagelgans Kevin and Coppock Christine
Current Estimated Value
Home Financials for this Owner
Home Financials are based on the most recent Mortgage that was taken out on this home.
Original Mortgage
$103,200
Interest Rate
6.13%
Mortgage Type
Stand Alone First
Purchase Details
Closed on
Jun 7, 2001
Sold by
Palmer Joana and Waite Joanna
Bought by
Coppock Christine
Purchase Details
Closed on
Jul 31, 2000
Sold by
Grahamdavid Grahamdavid J J and Grahamdavid Patricia A
Bought by
Mccomb Mark W and Nelson- Christine B
Purchase Details
Closed on
Aug 13, 1999
Bought by
Graham
Create a Home Valuation Report for This Property
The Home Valuation Report is an in-depth analysis detailing your home's value as well as a comparison with similar homes in the area
Home Values in the Area
Average Home Value in this Area
Purchase History
| Date | Buyer | Sale Price | Title Company |
|---|---|---|---|
| Hagelgans Kevin | $129,000 | Chicago Title Of Michigan | |
| Coppock Christine | $11,500 | None Available | |
| Mccomb Mark W | $125,000 | -- | |
| Graham | -- | -- |
Source: Public Records
Mortgage History
| Date | Status | Borrower | Loan Amount |
|---|---|---|---|
| Previous Owner | Hagelgans Kevin | $103,200 |
Source: Public Records
Tax History Compared to Growth
Tax History
| Year | Tax Paid | Tax Assessment Tax Assessment Total Assessment is a certain percentage of the fair market value that is determined by local assessors to be the total taxable value of land and additions on the property. | Land | Improvement |
|---|---|---|---|---|
| 2025 | -- | $78,600 | $0 | $0 |
| 2024 | $1,866 | $71,817 | $0 | $0 |
| 2023 | $2,133 | $54,310 | $0 | $0 |
| 2022 | $1,686 | $46,307 | $0 | $0 |
| 2021 | $2,012 | $44,335 | $0 | $0 |
| 2020 | $1,893 | $44,909 | $0 | $0 |
| 2019 | $1,875 | $43,926 | $0 | $0 |
| 2018 | $1,875 | $43,401 | $1,349 | $42,052 |
| 2017 | $1,774 | $40,460 | $0 | $0 |
| 2016 | $1,770 | $38,350 | $0 | $0 |
| 2015 | $1,795 | $38,420 | $2,456 | $35,964 |
| 2014 | $1,795 | $38,950 | $2,456 | $36,494 |
Source: Public Records
Map
Nearby Homes