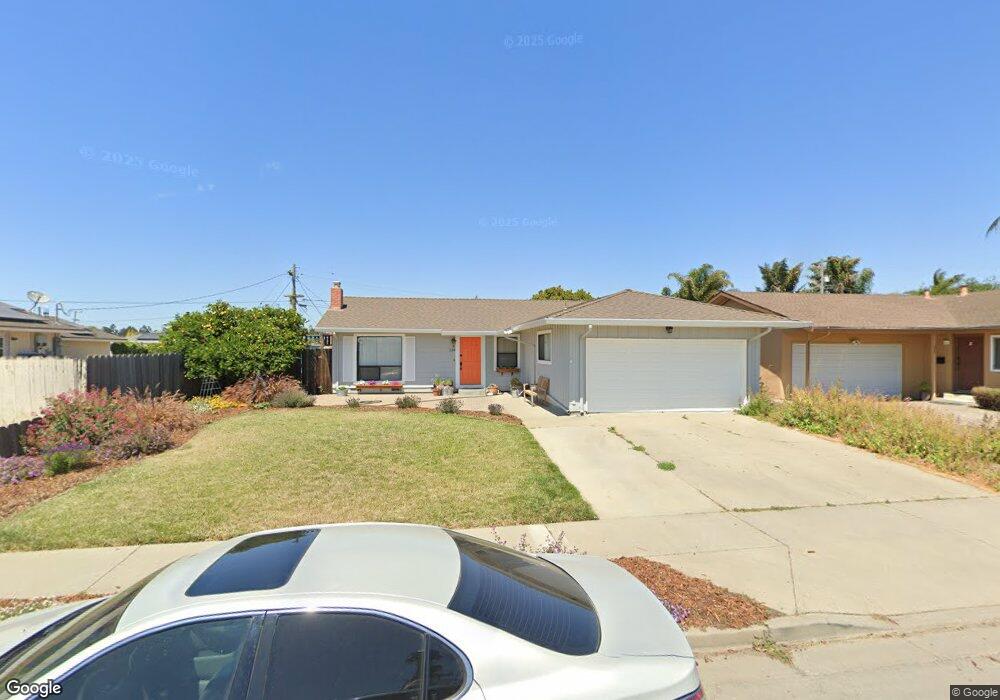
228 Kipling St Salinas, CA 93901
South Salinas NeighborhoodEstimated Value: $698,000 - $766,000
3
Beds
2
Baths
1,305
Sq Ft
$567/Sq Ft
Est. Value
About This Home
This home is located at 228 Kipling St, Salinas, CA 93901 and is currently estimated at $740,496, approximately $567 per square foot. 228 Kipling St is a home located in Monterey County with nearby schools including Monterey Park Elementary School, Mission Park Elementary School, and Lincoln Elementary School.
Ownership History
Date
Name
Owned For
Owner Type
Purchase Details
Closed on
Mar 1, 2016
Sold by
Bernal Alice
Bought by
Wilson Benjamin L and Wilson Alyssa B
Current Estimated Value
Home Financials for this Owner
Home Financials are based on the most recent Mortgage that was taken out on this home.
Original Mortgage
$200,000
Outstanding Balance
$86,512
Interest Rate
3.72%
Mortgage Type
New Conventional
Estimated Equity
$653,984
Purchase Details
Closed on
May 20, 2010
Sold by
Smith James H and Baker Family Trust
Bought by
Bernal Alice
Home Financials for this Owner
Home Financials are based on the most recent Mortgage that was taken out on this home.
Original Mortgage
$207,200
Interest Rate
5.03%
Mortgage Type
New Conventional
Purchase Details
Closed on
May 19, 2010
Sold by
Bernal Oscar
Bought by
Bernal Alice
Home Financials for this Owner
Home Financials are based on the most recent Mortgage that was taken out on this home.
Original Mortgage
$207,200
Interest Rate
5.03%
Mortgage Type
New Conventional
Purchase Details
Closed on
Oct 18, 1994
Sold by
Baker Jessie Marie
Bought by
Baker Jessie Marie and Baker Family Trust
Create a Home Valuation Report for This Property
The Home Valuation Report is an in-depth analysis detailing your home's value as well as a comparison with similar homes in the area
Home Values in the Area
Average Home Value in this Area
Purchase History
| Date | Buyer | Sale Price | Title Company |
|---|---|---|---|
| Wilson Benjamin L | $250,000 | First American Title Company | |
| Bernal Alice | $259,000 | First American Title Company | |
| Bernal Alice | -- | First American Title Company | |
| Baker Jessie Marie | -- | -- |
Source: Public Records
Mortgage History
| Date | Status | Borrower | Loan Amount |
|---|---|---|---|
| Open | Wilson Benjamin L | $200,000 | |
| Previous Owner | Bernal Alice | $207,200 |
Source: Public Records
Tax History
| Year | Tax Paid | Tax Assessment Tax Assessment Total Assessment is a certain percentage of the fair market value that is determined by local assessors to be the total taxable value of land and additions on the property. | Land | Improvement |
|---|---|---|---|---|
| 2025 | $4,423 | $334,307 | $129,073 | $205,234 |
| 2024 | $4,423 | $327,753 | $126,543 | $201,210 |
| 2023 | $3,716 | $321,327 | $124,062 | $197,265 |
| 2022 | $3,577 | $315,028 | $121,630 | $193,398 |
| 2021 | $3,436 | $308,852 | $119,246 | $189,606 |
| 2020 | $3,341 | $305,686 | $118,024 | $187,662 |
| 2019 | $3,317 | $299,693 | $115,710 | $183,983 |
| 2018 | $3,639 | $293,818 | $113,442 | $180,376 |
| 2017 | $3,453 | $288,058 | $111,218 | $176,840 |
| 2016 | $3,280 | $282,411 | $109,038 | $173,373 |
| 2015 | $3,577 | $278,170 | $107,401 | $170,769 |
| 2014 | $3,087 | $272,722 | $105,298 | $167,424 |
Source: Public Records
Map
Nearby Homes
- 1310 Primavera St Unit 118
- 451 La Jolla Way
- 132 Nissen Rd Unit 3
- 1223 La Canada Way
- 134 Nissen Rd Unit 2
- 330 Woodside Dr Unit 105
- 118 Nissen Rd Unit 1
- 138 Nissen Rd Unit 1
- 1053 Riker St Unit 6
- 1056 Padre Dr Unit 4
- 1056 Padre Dr Unit 8
- 1051 Riker St Unit 7
- 1067 Padre Dr Unit 2
- 1067 Padre Dr Unit 1
- 1051 Padre Dr Unit 7
- 929 Capistrano Dr
- 551 San Felipe St
- 50 Katherine Ave
- 54 Katherine Ave
- 1130 Montecito Cir
- 222 Kipling St
- 1357 Dickens Dr
- 14 Dickens Cir Unit 1
- 1349 Dickens Dr
- 20 Dickens Cir
- 218 Kipling St
- 210 Kipling St
- 24 Dickens Cir
- 246 Kipling St
- 1354 Dickens Dr
- 1348 Dickens Dr
- 1337 Dickens Dr
- 1360 Riker St Unit 1
- 1352 Riker St
- 21 Dickens Cir
- 1346 Riker St
- 15 Dickens Cir
- 1342 Dickens Dr
- 1340 Riker St
- 250 Kipling St
Your Personal Tour Guide
Ask me questions while you tour the home.