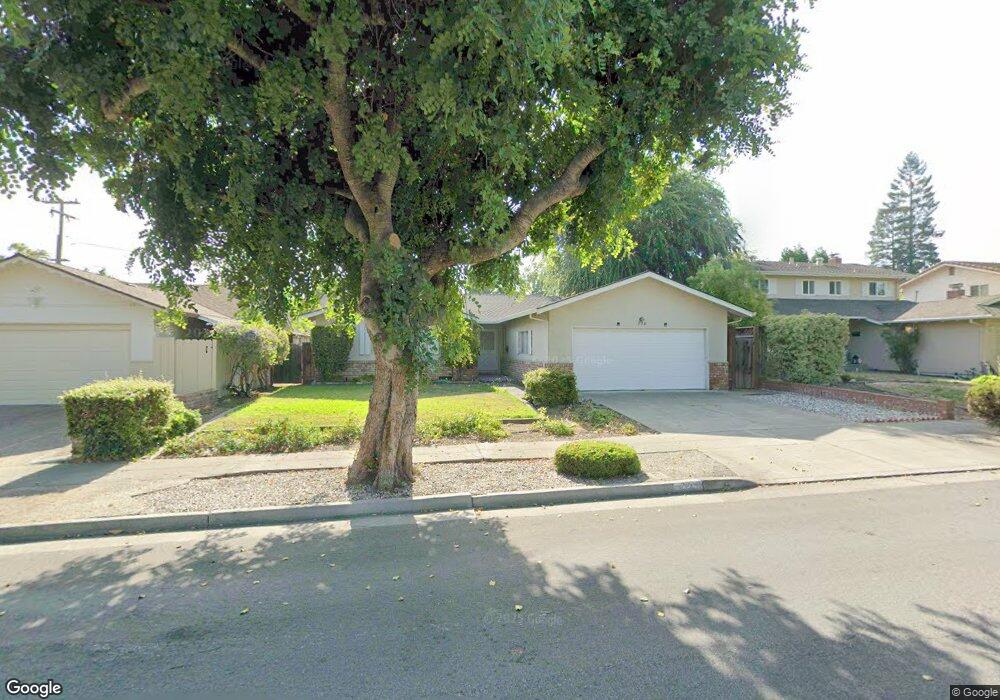
228 Lanitos Ave Sunnyvale, CA 94086
Estimated Value: $631,000 - $2,631,000
3
Beds
2
Baths
1,498
Sq Ft
$1,324/Sq Ft
Est. Value
About This Home
This home is located at 228 Lanitos Ave, Sunnyvale, CA 94086 and is currently estimated at $1,983,115, approximately $1,323 per square foot. 228 Lanitos Ave is a home located in Santa Clara County with nearby schools including Vargas Elementary School, Sunnyvale Middle School, and Homestead High School.
Ownership History
Date
Name
Owned For
Owner Type
Purchase Details
Closed on
Apr 28, 2025
Sold by
Park Kevin C
Bought by
M Barron Trust and Park 2007 Trust
Current Estimated Value
Purchase Details
Closed on
Mar 29, 2022
Sold by
Barron Melissa A
Bought by
M Barron Trust
Purchase Details
Closed on
Mar 23, 2022
Sold by
Barron Melissa A
Bought by
M Barron Trust
Purchase Details
Closed on
Jan 13, 2021
Sold by
Mangini Albert D and Mangini Catherine H
Bought by
Carr Michele M and Barron Melissa A
Purchase Details
Closed on
Sep 11, 2019
Sold by
Park Louis W and Carroll W Park Trust
Bought by
Park Louis W and Park Kevin C
Purchase Details
Closed on
Apr 12, 2007
Sold by
Park Carroll Wayne
Bought by
Park Carroll W
Purchase Details
Closed on
Apr 8, 1998
Sold by
Mangini Albert D and Mangini Catherine H
Bought by
Mangini Albert D and Mangini Catherine H
Create a Home Valuation Report for This Property
The Home Valuation Report is an in-depth analysis detailing your home's value as well as a comparison with similar homes in the area
Purchase History
| Date | Buyer | Sale Price | Title Company |
|---|---|---|---|
| M Barron Trust | $600,000 | None Listed On Document | |
| M Barron Trust | -- | None Listed On Document | |
| M Barron Trust | -- | None Listed On Document | |
| Carr Michele M | -- | None Listed On Document | |
| Mangini Albert D | -- | None Listed On Document | |
| Park Louis W | -- | None Available | |
| Park Louis W | -- | None Available | |
| Park Carroll W | -- | None Available | |
| Mangini Albert D | -- | -- |
Source: Public Records
Tax History
| Year | Tax Paid | Tax Assessment Tax Assessment Total Assessment is a certain percentage of the fair market value that is determined by local assessors to be the total taxable value of land and additions on the property. | Land | Improvement |
|---|---|---|---|---|
| 2025 | $1,451 | $104,828 | $30,460 | $74,368 |
| 2024 | $1,451 | $102,773 | $29,863 | $72,910 |
| 2023 | $1,438 | $100,759 | $29,278 | $71,481 |
| 2022 | $1,423 | $98,784 | $28,704 | $70,080 |
| 2021 | $1,409 | $96,848 | $28,142 | $68,706 |
| 2020 | $1,392 | $95,856 | $27,854 | $68,002 |
| 2019 | $1,367 | $93,977 | $27,308 | $66,669 |
| 2018 | $1,343 | $92,135 | $26,773 | $65,362 |
| 2017 | $1,326 | $90,330 | $26,249 | $64,081 |
| 2016 | $1,272 | $88,560 | $25,735 | $62,825 |
| 2015 | $1,276 | $87,231 | $25,349 | $61,882 |
| 2014 | $1,255 | $85,523 | $24,853 | $60,670 |
Source: Public Records
Map
Nearby Homes
- 248 S Bernardo Ave
- 1248 Cortez Dr
- 1237 Coronado Dr
- 1241 Coronado Dr
- 377 S Mary Ave
- 136 S Mary Ave
- 433 Sylvan Ave Unit 120
- 433 Sylvan Ave Unit 84
- 433 Sylvan Ave Unit 134
- 992 Alpine Terrace Unit 5
- 992 Alpine Terrace Unit 6
- 325 Sylvan Ave Unit 23
- 325 Sylvan Ave
- 451 Chagall St
- 972 Belmont Terrace Unit 7
- 1031 Crestview Dr Unit 305
- 975 Belmont Terrace Unit 2
- 962 Belmont Terrace Unit 9
- 411 Hedgerow Ct
- 839 Coolidge Ave
- 220 Lanitos Ave
- 236 Lanitos Ave
- 239 Leota Ave
- 229 Leota Ave
- 1112 W Washington Ave
- 244 Lanitos Ave
- 249 Leota Ave
- 229 Lanitos Ave
- 1102 W Washington Ave
- 237 Lanitos Ave
- 259 Leota Ave
- 252 Lanitos Ave
- 211 Lanitos Ave
- 245 Lanitos Ave
- 269 Leota Ave
- 278 Gabilan Ave
- 260 Lanitos Ave
- 228 Gabilan Ave
- 220 Gabilan Ave
- 236 Gabilan Ave
Your Personal Tour Guide
Ask me questions while you tour the home.