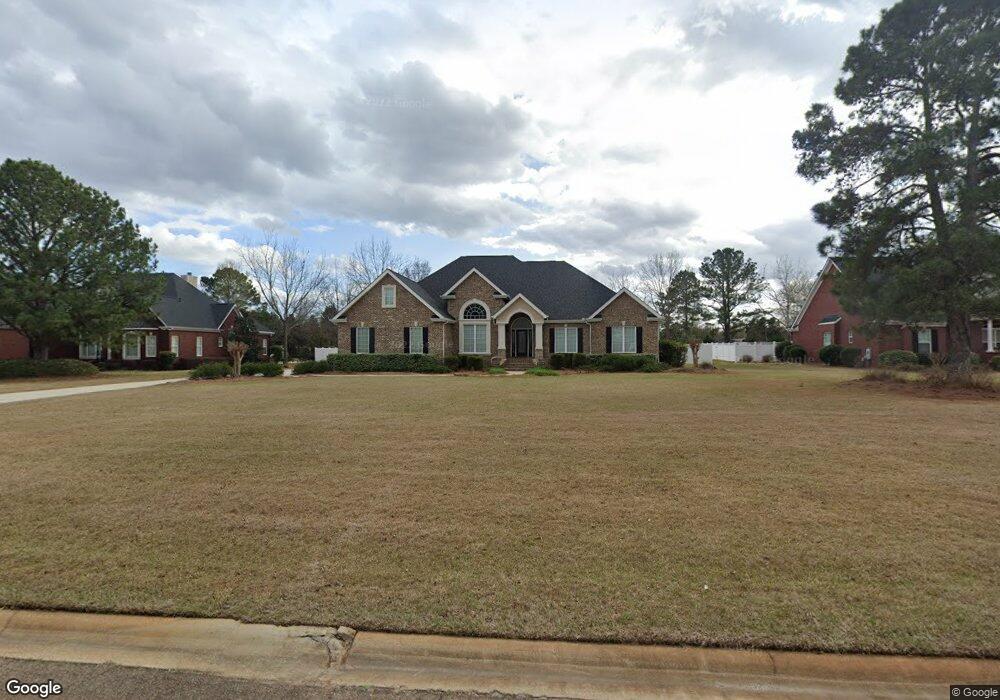
228 Liberty Trace Macon, GA 31216
Estimated Value: $463,000 - $515,000
3
Beds
2
Baths
2,846
Sq Ft
$169/Sq Ft
Est. Value
About This Home
This home is located at 228 Liberty Trace, Macon, GA 31216 and is currently estimated at $481,922, approximately $169 per square foot. 228 Liberty Trace is a home with nearby schools including Heard Elementary School, Rutland Middle School, and Rutland High School.
Ownership History
Date
Name
Owned For
Owner Type
Purchase Details
Closed on
Feb 5, 2025
Sold by
Smith Stockton T and Smith Lisa L
Bought by
247 Group Llc
Current Estimated Value
Purchase Details
Closed on
Feb 11, 2013
Sold by
Hall Merrell G
Bought by
Smith Stockton T and Smith Lisa L
Home Financials for this Owner
Home Financials are based on the most recent Mortgage that was taken out on this home.
Original Mortgage
$212,500
Interest Rate
3.43%
Mortgage Type
Purchase Money Mortgage
Purchase Details
Closed on
Apr 20, 2007
Sold by
Middleton Glynda G
Bought by
Hall Merrell G
Purchase Details
Closed on
Oct 13, 2006
Sold by
William Oliver Hall Trust Fund
Bought by
Middleton Glynda G
Home Financials for this Owner
Home Financials are based on the most recent Mortgage that was taken out on this home.
Original Mortgage
$45,000
Interest Rate
6.39%
Mortgage Type
Purchase Money Mortgage
Purchase Details
Closed on
Aug 4, 2003
Create a Home Valuation Report for This Property
The Home Valuation Report is an in-depth analysis detailing your home's value as well as a comparison with similar homes in the area
Home Values in the Area
Average Home Value in this Area
Purchase History
| Date | Buyer | Sale Price | Title Company |
|---|---|---|---|
| 247 Group Llc | $450,000 | None Listed On Document | |
| 247 Group Llc | $450,000 | None Listed On Document | |
| Smith Stockton T | $40,000 | None Available | |
| Hall Merrell G | $52,500 | None Available | |
| Middleton Glynda G | $50,400 | None Available | |
| -- | -- | -- |
Source: Public Records
Mortgage History
| Date | Status | Borrower | Loan Amount |
|---|---|---|---|
| Previous Owner | Smith Stockton T | $212,500 | |
| Previous Owner | Middleton Glynda G | $45,000 |
Source: Public Records
Tax History Compared to Growth
Tax History
| Year | Tax Paid | Tax Assessment Tax Assessment Total Assessment is a certain percentage of the fair market value that is determined by local assessors to be the total taxable value of land and additions on the property. | Land | Improvement |
|---|---|---|---|---|
| 2025 | $4,502 | $190,213 | $18,270 | $171,943 |
| 2024 | $4,653 | $190,213 | $18,270 | $171,943 |
| 2023 | $2,026 | $123,243 | $20,000 | $103,243 |
| 2022 | $4,024 | $123,243 | $20,000 | $103,243 |
| 2021 | $4,417 | $123,243 | $20,000 | $103,243 |
| 2020 | $3,799 | $123,243 | $20,000 | $103,243 |
| 2019 | $4,345 | $117,990 | $20,000 | $97,990 |
| 2018 | $6,834 | $117,990 | $20,000 | $97,990 |
| 2017 | $4,158 | $117,990 | $20,000 | $97,990 |
| 2016 | $3,840 | $117,990 | $20,000 | $97,990 |
| 2015 | $5,436 | $117,990 | $20,000 | $97,990 |
| 2014 | $5,924 | $131,774 | $20,000 | $111,774 |
Source: Public Records
Map
Nearby Homes
- 224 Liberty Trace
- 236 Liberty Trace
- 241 Liberty Trace
- 233 Liberty Trace
- 245 Liberty Trace
- 229 Liberty Trace
- 108 Liberty Ridge Dr
- 221 Liberty Trace
- 2871 Liberty Church Rd
- 2891 Liberty Church Rd
- 127 Alan Ct
- 2841 Liberty Church Rd
- 0 Liberty Ridge Dr Unit 7403011
- 0 Liberty Ridge Dr Unit 7053054
- 0 Liberty Ridge Dr Unit 8047654
- 0 Liberty Ridge Dr
- 126 Alan Ct
- 217 Liberty Trace
- 2831 Liberty Church Rd
- 125 Alan Ct