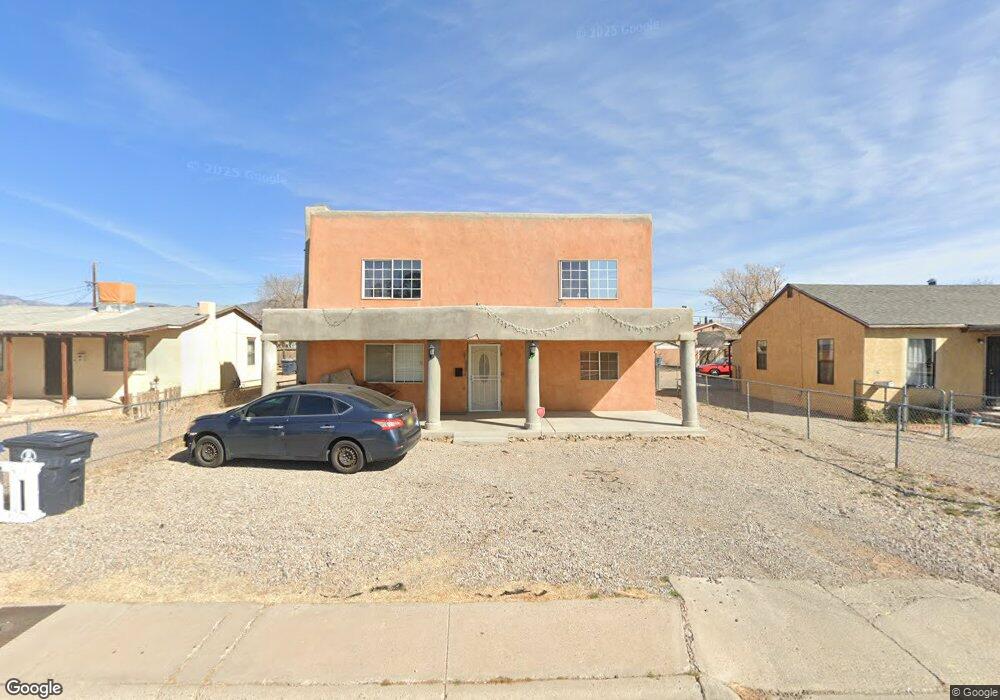
228 Mesilla St NE Albuquerque, NM 87108
Fairgrounds NeighborhoodEstimated Value: $225,166 - $290,000
3
Beds
1
Bath
2,464
Sq Ft
$104/Sq Ft
Est. Value
About This Home
This home is located at 228 Mesilla St NE, Albuquerque, NM 87108 and is currently estimated at $257,042, approximately $104 per square foot. 228 Mesilla St NE is a home located in Bernalillo County with nearby schools including La Mesa Elementary School, Hayes Middle School, and Highland High School.
Ownership History
Date
Name
Owned For
Owner Type
Purchase Details
Closed on
Oct 24, 2011
Sold by
Secretary Of Housing & Urban Development
Bought by
Griego Gerome J
Current Estimated Value
Purchase Details
Closed on
May 18, 2010
Sold by
Bac Home Loans Servicing Lp
Bought by
The Secretary Of Housing & Urban Develop
Purchase Details
Closed on
Dec 15, 2009
Sold by
Angulo Flavio
Bought by
Bac Home Loans Servicing Lp
Purchase Details
Closed on
Sep 5, 2006
Sold by
Lowther Rise K
Bought by
Angulo Flavo
Home Financials for this Owner
Home Financials are based on the most recent Mortgage that was taken out on this home.
Original Mortgage
$84,000
Interest Rate
8.92%
Mortgage Type
Purchase Money Mortgage
Purchase Details
Closed on
Apr 18, 2001
Sold by
Benstein Martin A and Benstein Hannah L
Bought by
Lowther Rise K
Home Financials for this Owner
Home Financials are based on the most recent Mortgage that was taken out on this home.
Original Mortgage
$78,403
Interest Rate
6.89%
Mortgage Type
FHA
Create a Home Valuation Report for This Property
The Home Valuation Report is an in-depth analysis detailing your home's value as well as a comparison with similar homes in the area
Home Values in the Area
Average Home Value in this Area
Purchase History
| Date | Buyer | Sale Price | Title Company |
|---|---|---|---|
| Griego Gerome J | -- | Fidelity Natl Title Ins Co | |
| The Secretary Of Housing & Urban Develop | -- | None Available | |
| Bac Home Loans Servicing Lp | -- | None Available | |
| Angulo Flavo | -- | First American Title Ins Co | |
| Lowther Rise K | -- | Stewart Title |
Source: Public Records
Mortgage History
| Date | Status | Borrower | Loan Amount |
|---|---|---|---|
| Previous Owner | Angulo Flavo | $84,000 | |
| Previous Owner | Lowther Rise K | $78,403 | |
| Closed | Lowther Rise K | $3,975 |
Source: Public Records
Tax History Compared to Growth
Tax History
| Year | Tax Paid | Tax Assessment Tax Assessment Total Assessment is a certain percentage of the fair market value that is determined by local assessors to be the total taxable value of land and additions on the property. | Land | Improvement |
|---|---|---|---|---|
| 2025 | $1,379 | $33,667 | $6,902 | $26,765 |
| 2024 | $1,379 | $32,686 | $6,701 | $25,985 |
| 2023 | $1,356 | $31,735 | $6,506 | $25,229 |
| 2022 | $1,310 | $30,811 | $6,317 | $24,494 |
| 2021 | $1,267 | $29,914 | $6,133 | $23,781 |
| 2020 | $1,246 | $29,043 | $5,955 | $23,088 |
| 2019 | $1,209 | $28,197 | $5,781 | $22,416 |
| 2018 | $1,166 | $28,197 | $5,781 | $22,416 |
| 2017 | $1,130 | $27,376 | $5,613 | $21,763 |
| 2016 | $1,098 | $25,806 | $5,291 | $20,515 |
| 2015 | $25,054 | $25,054 | $5,137 | $19,917 |
| 2014 | $1,033 | $24,325 | $4,988 | $19,337 |
| 2013 | -- | $23,617 | $4,843 | $18,774 |
Source: Public Records
Map
Nearby Homes
- 218 Alcazar St NE
- 138 Mesilla St NE
- 240 San Pablo St NE
- 236 San Pablo St NE
- 310 Grove St NE
- 335 Alcazar St NE
- 422 Chama St NE
- 330 Charleston St NE
- 407 Dallas St NE
- 323 Dallas St NE
- 219 Dallas St NE
- 513 Mesilla St NE
- 610 Espanola St NE
- 321 Rhode Island St NE
- 325 Rhode Island St NE
- 110 Indiana St SE Unit 1-7
- 118 Charleston St SE
- 115 Dallas St SE
- 128 Rhode Island St NE
- 325 Tennessee St NE
- 234 Mesilla St NE
- 226 Mesilla St NE
- 238 Mesilla St NE
- 218 Mesilla St NE
- 331 Espanola St NE
- 216 Mesilla St NE
- 242 Mesilla St NE
- 235 Mesilla St NE
- 233 Mesilla St NE
- 223 Mesilla St NE
- 333 Espanola St NE
- 323 Espanola St NE
- 323 Espanola St NE
- 212 Mesilla St NE
- 246 Mesilla St NE
- 239 Mesilla St NE
- 243 Mesilla St NE
- 243 Mesilla St NE Unit 3
- 319 Espanola St NE
- 208 Mesilla St NE