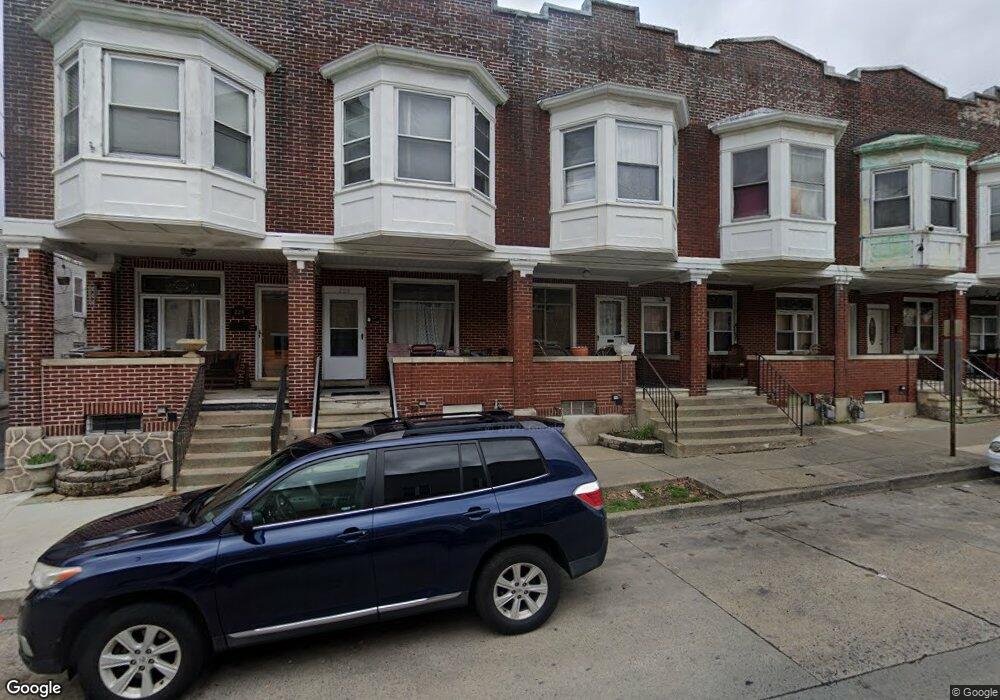
228 N 5th St Allentown, PA 18102
Center City NeighborhoodEstimated Value: $208,000 - $228,000
4
Beds
2
Baths
1,670
Sq Ft
$129/Sq Ft
Est. Value
About This Home
This home is located at 228 N 5th St, Allentown, PA 18102 and is currently estimated at $215,974, approximately $129 per square foot. 228 N 5th St is a home located in Lehigh County with nearby schools including Central Elementary School, San Rafael Junior High School, and Harrison-Morton Middle School.
Ownership History
Date
Name
Owned For
Owner Type
Purchase Details
Closed on
Dec 7, 1998
Sold by
Spaits Kelly and Spaits Lloyd Kelly
Bought by
Crawl Sandy D
Current Estimated Value
Purchase Details
Closed on
Jun 16, 1997
Sold by
Hud
Bought by
Spaits Kelly
Purchase Details
Closed on
Feb 10, 1997
Sold by
Atlantic Mortgage & Investment Corp
Bought by
Sec Of Housing & Urban Development
Purchase Details
Closed on
Jan 24, 1997
Sold by
Banks Hector and Banks Carlota
Bought by
Atlantic Mortgage & Investment Corp
Purchase Details
Closed on
Jun 15, 1988
Bought by
Banks Hector and Banks Carlota
Create a Home Valuation Report for This Property
The Home Valuation Report is an in-depth analysis detailing your home's value as well as a comparison with similar homes in the area
Home Values in the Area
Average Home Value in this Area
Purchase History
| Date | Buyer | Sale Price | Title Company |
|---|---|---|---|
| Crawl Sandy D | $51,900 | -- | |
| Spaits Kelly | $22,000 | -- | |
| Sec Of Housing & Urban Development | -- | -- | |
| Atlantic Mortgage & Investment Corp | -- | -- | |
| Banks Hector | $54,000 | -- |
Source: Public Records
Tax History Compared to Growth
Tax History
| Year | Tax Paid | Tax Assessment Tax Assessment Total Assessment is a certain percentage of the fair market value that is determined by local assessors to be the total taxable value of land and additions on the property. | Land | Improvement |
|---|---|---|---|---|
| 2025 | $2,565 | $80,300 | $4,500 | $75,800 |
| 2024 | $2,565 | $80,300 | $4,500 | $75,800 |
| 2023 | $2,565 | $80,300 | $4,500 | $75,800 |
| 2022 | $2,474 | $80,300 | $75,800 | $4,500 |
| 2021 | $2,423 | $80,300 | $4,500 | $75,800 |
| 2020 | $2,359 | $80,300 | $4,500 | $75,800 |
| 2019 | $2,320 | $80,300 | $4,500 | $75,800 |
| 2018 | $2,172 | $80,300 | $4,500 | $75,800 |
| 2017 | $2,116 | $80,300 | $4,500 | $75,800 |
| 2016 | -- | $80,300 | $4,500 | $75,800 |
| 2015 | -- | $80,300 | $4,500 | $75,800 |
| 2014 | -- | $80,300 | $4,500 | $75,800 |
Source: Public Records
Map
Nearby Homes