Estimated Value: $586,000 - $772,000
5
Beds
4
Baths
2,573
Sq Ft
$267/Sq Ft
Est. Value
About This Home
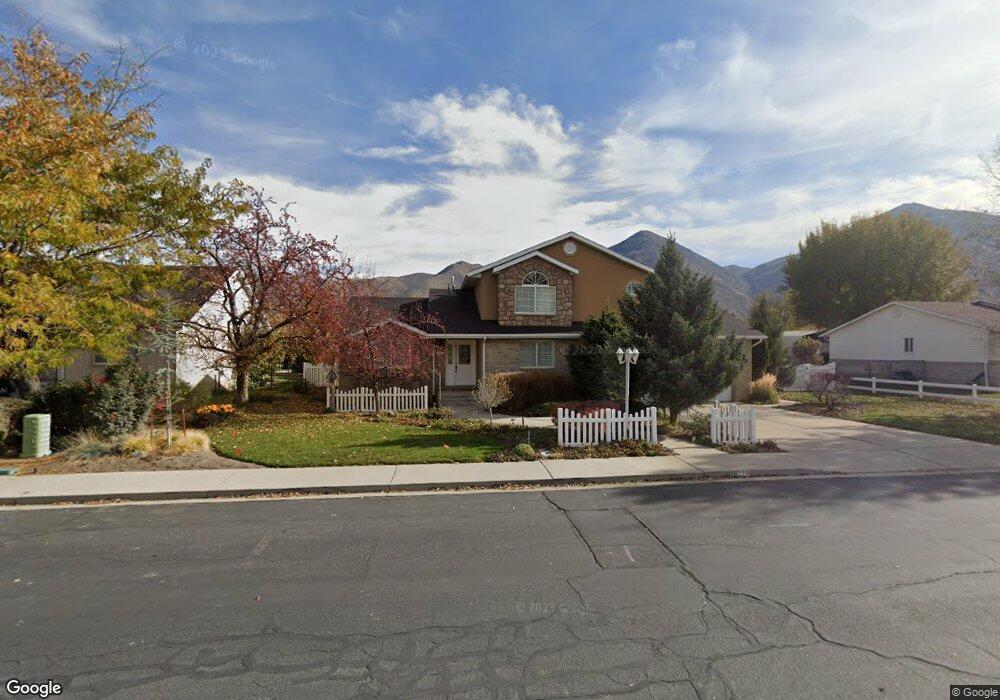
This home is located at 228 N 600 E, Salem, UT 84653 and is currently estimated at $687,309, approximately $267 per square foot. 228 N 600 E is a home located in Utah County with nearby schools including Salem Elementary, Valley View Middle School, and Salem Junior High School.
Ownership History
Date
Name
Owned For
Owner Type
Purchase Details
Closed on
Aug 12, 2024
Sold by
Hurst Family Trust and Caler Laura Joellen
Bought by
Hatty Investments Llc
Current Estimated Value
Purchase Details
Closed on
Aug 20, 2004
Sold by
Hurst Bruce P and Hurst Elaine J
Bought by
Hurst Bruce P and Hurst Elaine J
Home Financials for this Owner
Home Financials are based on the most recent Mortgage that was taken out on this home.
Original Mortgage
$75,000
Interest Rate
5.95%
Mortgage Type
New Conventional
Create a Home Valuation Report for This Property
The Home Valuation Report is an in-depth analysis detailing your home's value as well as a comparison with similar homes in the area
Home Values in the Area
Average Home Value in this Area
Purchase History
| Date | Buyer | Sale Price | Title Company |
|---|---|---|---|
| Hatty Investments Llc | -- | Protitle | |
| Hurst Bruce P | -- | Pro Title & Escrow Inc |
Source: Public Records
Mortgage History
| Date | Status | Borrower | Loan Amount |
|---|---|---|---|
| Previous Owner | Hurst Bruce P | $75,000 |
Source: Public Records
Tax History
| Year | Tax Paid | Tax Assessment Tax Assessment Total Assessment is a certain percentage of the fair market value that is determined by local assessors to be the total taxable value of land and additions on the property. | Land | Improvement |
|---|---|---|---|---|
| 2025 | $3,166 | $345,070 | -- | -- |
| 2024 | $3,166 | $321,090 | $0 | $0 |
| 2023 | $3,231 | $328,240 | $0 | $0 |
| 2022 | $3,049 | $305,030 | $0 | $0 |
| 2021 | $2,506 | $402,200 | $105,900 | $296,300 |
| 2020 | $2,406 | $375,800 | $96,300 | $279,500 |
| 2019 | $2,330 | $371,600 | $92,100 | $279,500 |
| 2018 | $2,232 | $340,300 | $83,700 | $256,600 |
| 2017 | $2,176 | $176,880 | $0 | $0 |
| 2016 | $2,100 | $168,795 | $0 | $0 |
| 2015 | $2,021 | $159,555 | $0 | $0 |
| 2014 | $1,863 | $147,235 | $0 | $0 |
Source: Public Records
Map
Nearby Homes
- 643-1209 N 1850 E
- 659-1205 N 1850 E
- 315 N 500 E
- 2165 E 270 N Unit MSF47
- 2153 E 270 N Unit MSF48
- 2152 E 270 N Unit MSF50
- 2174 E 270 N Unit MSF51
- 2148 E 270 N Unit MSF49
- 438 N 500 E Unit LOT 2
- 84 N 500 E
- 663-1204 N 1850 E
- 647-1208 N 1850 E
- 384 N 710 E
- 644 N 500 E Unit 111
- 513 E 400 North St
- 846 E 400 St N
- 6 Shady Ln
- 443 N 500 E Unit LOT 2
- 453 N 500 E Unit LOT 3
- 465 N 500 E Unit LOT 4
Your Personal Tour Guide
Ask me questions while you tour the home.