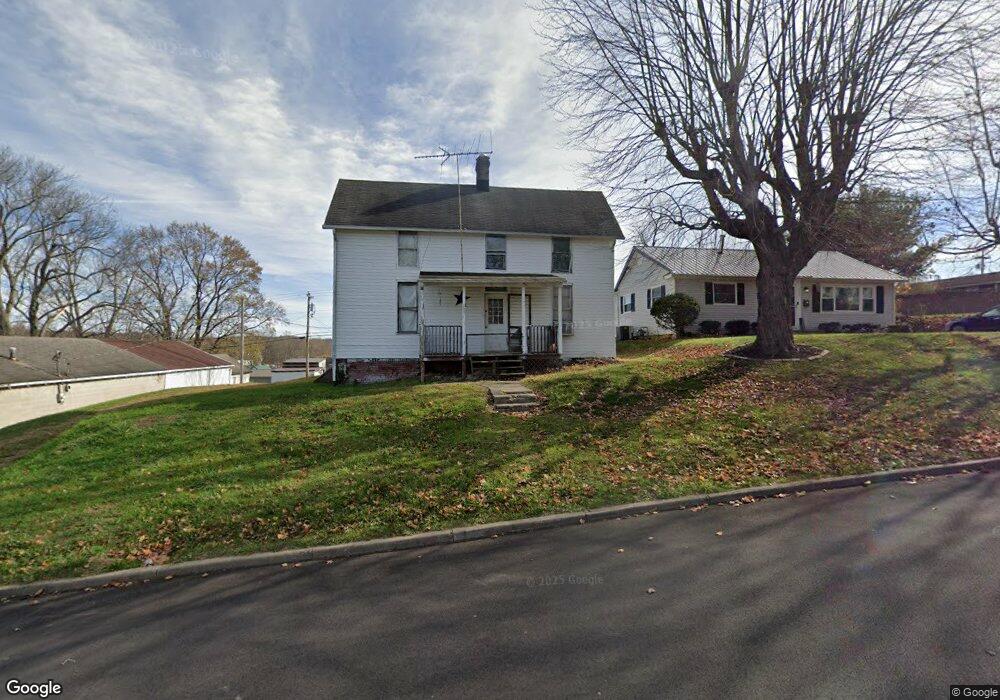
228 N High St Jackson, OH 45640
Estimated Value: $66,000 - $200,000
5
Beds
1
Bath
1,440
Sq Ft
$88/Sq Ft
Est. Value
About This Home
This home is located at 228 N High St, Jackson, OH 45640 and is currently estimated at $126,414, approximately $87 per square foot. 228 N High St is a home located in Jackson County with nearby schools including Jackson High School and Christian Life Academy.
Ownership History
Date
Name
Owned For
Owner Type
Purchase Details
Closed on
Jun 12, 2019
Sold by
Williams Trevor
Bought by
Brown Sherman D
Current Estimated Value
Purchase Details
Closed on
Dec 28, 2018
Sold by
Jpar Four Llc
Bought by
Williams Trevor
Purchase Details
Closed on
Dec 23, 2009
Sold by
Parker Michael B
Bought by
Parker Michael Jerrod
Purchase Details
Closed on
May 24, 2005
Sold by
Adkins Helen V
Bought by
Parker Michael B
Home Financials for this Owner
Home Financials are based on the most recent Mortgage that was taken out on this home.
Original Mortgage
$25,900
Interest Rate
7.45%
Mortgage Type
Purchase Money Mortgage
Create a Home Valuation Report for This Property
The Home Valuation Report is an in-depth analysis detailing your home's value as well as a comparison with similar homes in the area
Home Values in the Area
Average Home Value in this Area
Purchase History
| Date | Buyer | Sale Price | Title Company |
|---|---|---|---|
| Brown Sherman D | $20,000 | Bestitle Agency Inc | |
| Williams Trevor | $15,000 | None Available | |
| Parker Michael Jerrod | -- | None Available | |
| Parker Michael B | $30,000 | None Available |
Source: Public Records
Mortgage History
| Date | Status | Borrower | Loan Amount |
|---|---|---|---|
| Previous Owner | Parker Michael B | $25,900 |
Source: Public Records
Tax History Compared to Growth
Tax History
| Year | Tax Paid | Tax Assessment Tax Assessment Total Assessment is a certain percentage of the fair market value that is determined by local assessors to be the total taxable value of land and additions on the property. | Land | Improvement |
|---|---|---|---|---|
| 2024 | $1,650 | $28,520 | $6,490 | $22,030 |
| 2023 | $1,077 | $28,520 | $6,490 | $22,030 |
| 2022 | $1,171 | $22,960 | $6,110 | $16,850 |
| 2021 | $934 | $22,960 | $6,110 | $16,850 |
| 2020 | $463 | $22,960 | $6,110 | $16,850 |
| 2019 | $818 | $20,320 | $5,410 | $14,910 |
| 2018 | $808 | $20,320 | $5,410 | $14,910 |
| 2017 | $775 | $20,320 | $5,410 | $14,910 |
| 2016 | $733 | $18,980 | $5,250 | $13,730 |
| 2015 | $737 | $18,980 | $5,250 | $13,730 |
| 2013 | $711 | $18,340 | $5,250 | $13,090 |
| 2012 | $721 | $18,340 | $5,250 | $13,090 |
Source: Public Records
Map
Nearby Homes