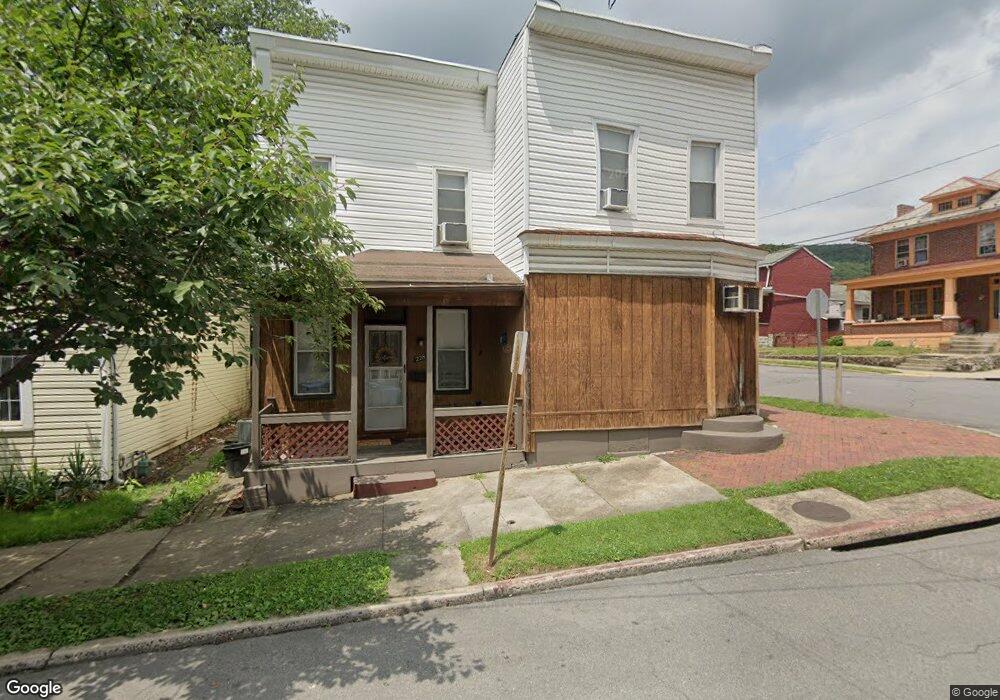
228 Pear St Cumberland, MD 21502
Estimated Value: $87,000 - $135,000
--
Bed
3
Baths
3,328
Sq Ft
$32/Sq Ft
Est. Value
About This Home
This home is located at 228 Pear St, Cumberland, MD 21502 and is currently estimated at $107,335, approximately $32 per square foot. 228 Pear St is a home located in Allegany County with nearby schools including Northeast Elementary School, Braddock Middle School, and Allegany High School.
Ownership History
Date
Name
Owned For
Owner Type
Purchase Details
Closed on
Mar 11, 2008
Sold by
Bloom Jason M and Bloom Sharon L
Bought by
Dieterle Brian
Current Estimated Value
Home Financials for this Owner
Home Financials are based on the most recent Mortgage that was taken out on this home.
Original Mortgage
$100,424
Outstanding Balance
$62,495
Interest Rate
5.72%
Mortgage Type
FHA
Estimated Equity
$44,840
Purchase Details
Closed on
Mar 3, 2008
Sold by
Bloom Jason M and Bloom Sharon L
Bought by
Dieterle Brian
Home Financials for this Owner
Home Financials are based on the most recent Mortgage that was taken out on this home.
Original Mortgage
$100,424
Outstanding Balance
$62,495
Interest Rate
5.72%
Mortgage Type
FHA
Estimated Equity
$44,840
Purchase Details
Closed on
Mar 22, 2006
Sold by
Thoman William
Bought by
Bloom Jason
Purchase Details
Closed on
Aug 14, 1996
Sold by
Thompson Richard James and Thompson Sherry Ann
Bought by
Thoman William
Create a Home Valuation Report for This Property
The Home Valuation Report is an in-depth analysis detailing your home's value as well as a comparison with similar homes in the area
Home Values in the Area
Average Home Value in this Area
Purchase History
| Date | Buyer | Sale Price | Title Company |
|---|---|---|---|
| Dieterle Brian | $102,000 | -- | |
| Dieterle Brian | $102,000 | -- | |
| Bloom Jason | $40,000 | -- | |
| Bloom Jason | $40,000 | -- | |
| Thoman William | $36,000 | -- |
Source: Public Records
Mortgage History
| Date | Status | Borrower | Loan Amount |
|---|---|---|---|
| Open | Dieterle Brian | $100,424 | |
| Closed | Dieterle Brian | $100,424 |
Source: Public Records
Tax History Compared to Growth
Tax History
| Year | Tax Paid | Tax Assessment Tax Assessment Total Assessment is a certain percentage of the fair market value that is determined by local assessors to be the total taxable value of land and additions on the property. | Land | Improvement |
|---|---|---|---|---|
| 2025 | $741 | $80,900 | $0 | $0 |
| 2024 | $691 | $73,800 | $0 | $0 |
| 2023 | $621 | $66,700 | $6,000 | $60,700 |
| 2022 | $605 | $65,233 | $0 | $0 |
| 2021 | $596 | $63,767 | $0 | $0 |
| 2020 | $579 | $62,300 | $6,000 | $56,300 |
| 2019 | $582 | $62,267 | $0 | $0 |
| 2018 | $592 | $62,233 | $0 | $0 |
| 2017 | $587 | $62,200 | $0 | $0 |
| 2016 | $596 | $62,200 | $0 | $0 |
| 2015 | $854 | $62,200 | $0 | $0 |
| 2014 | $854 | $88,400 | $0 | $0 |
Source: Public Records
Map
Nearby Homes
- 530 Columbia Ave
- 516 Shriver Ave
- 501 Columbia Ave
- 461 Columbia St
- 601 Shriver Ave
- 626 Columbia Ave
- 411 Pulaski St
- 449 Columbia St
- 444 Columbia St
- 412 Furnace St
- 632 Fairview Ave
- 433 Columbia St
- 623 Fairview Ave
- 418 Columbia St
- 407 Columbia St
- 511 Franklin St
- 408 Chestnut St
- 727 Shawnee Ave
- 415 Independence St
- 840 Columbia Ave