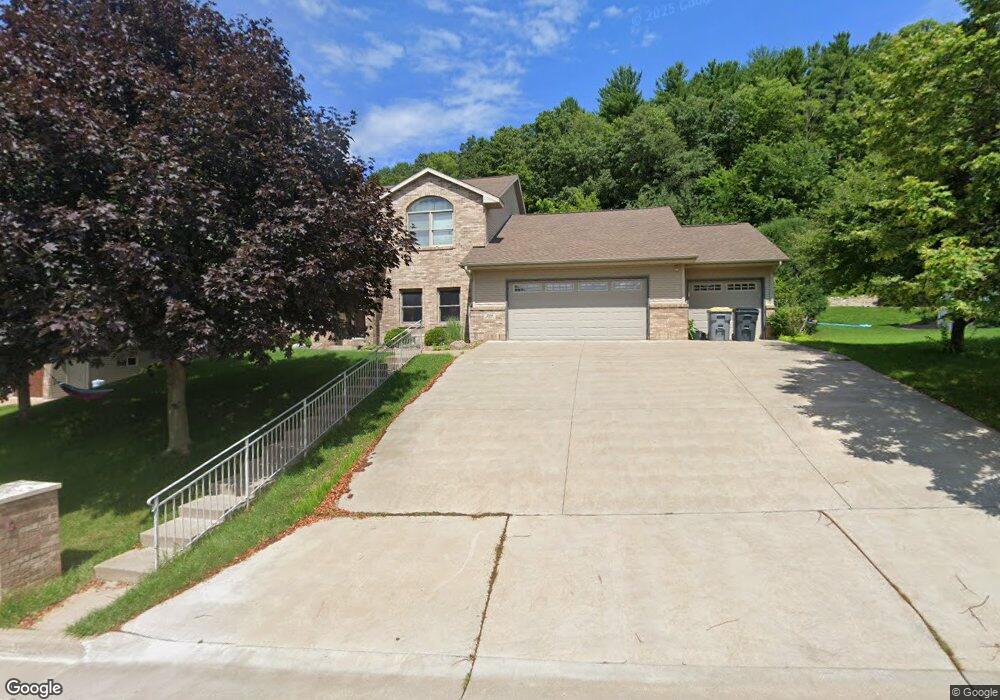
228 Red Apple Dr La Crescent, MN 55947
Estimated Value: $609,000 - $920,000
4
Beds
4
Baths
3,140
Sq Ft
$225/Sq Ft
Est. Value
About This Home
This home is located at 228 Red Apple Dr, La Crescent, MN 55947 and is currently estimated at $705,649, approximately $224 per square foot. 228 Red Apple Dr is a home located in Houston County with nearby schools including La Crescent-Hokah Elementary School, La Crescent-Hokah Middle School, and La Crescent-Hokah High School.
Ownership History
Date
Name
Owned For
Owner Type
Purchase Details
Closed on
Oct 11, 2007
Sold by
Byom Michael C and Byom Kelly L
Bought by
Byom Michael C
Current Estimated Value
Home Financials for this Owner
Home Financials are based on the most recent Mortgage that was taken out on this home.
Original Mortgage
$417,000
Outstanding Balance
$262,640
Interest Rate
6.38%
Mortgage Type
New Conventional
Estimated Equity
$443,009
Purchase Details
Closed on
Oct 11, 2006
Sold by
Zabriskie Thomas C and Zabriskie Brenda J
Bought by
Byom Michael C and Byom Kelly L
Home Financials for this Owner
Home Financials are based on the most recent Mortgage that was taken out on this home.
Original Mortgage
$446,939
Interest Rate
6.4%
Mortgage Type
Future Advance Clause Open End Mortgage
Create a Home Valuation Report for This Property
The Home Valuation Report is an in-depth analysis detailing your home's value as well as a comparison with similar homes in the area
Home Values in the Area
Average Home Value in this Area
Purchase History
| Date | Buyer | Sale Price | Title Company |
|---|---|---|---|
| Byom Michael C | -- | None Available | |
| Byom Michael C | $410,000 | None Available |
Source: Public Records
Mortgage History
| Date | Status | Borrower | Loan Amount |
|---|---|---|---|
| Open | Byom Michael C | $417,000 | |
| Previous Owner | Byom Michael C | $446,939 |
Source: Public Records
Tax History Compared to Growth
Tax History
| Year | Tax Paid | Tax Assessment Tax Assessment Total Assessment is a certain percentage of the fair market value that is determined by local assessors to be the total taxable value of land and additions on the property. | Land | Improvement |
|---|---|---|---|---|
| 2025 | $9,482 | $698,800 | $78,200 | $620,600 |
| 2024 | $10,100 | $618,800 | $78,200 | $540,600 |
| 2023 | $10,066 | $635,100 | $59,000 | $576,100 |
| 2022 | $8,496 | $635,100 | $59,000 | $576,100 |
| 2021 | $8,426 | $470,600 | $59,000 | $411,600 |
| 2020 | $8,712 | $470,600 | $59,000 | $411,600 |
| 2019 | $7,480 | $484,800 | $59,000 | $425,800 |
| 2018 | $6,834 | $431,600 | $59,000 | $372,600 |
| 2017 | $6,834 | $388,300 | $56,395 | $331,905 |
| 2016 | $6,672 | $422,500 | $56,700 | $365,800 |
| 2015 | $6,296 | $400,000 | $53,600 | $346,400 |
| 2014 | $6,296 | $398,800 | $53,439 | $345,361 |
Source: Public Records
Map
Nearby Homes
- 225 Red Apple Dr
- 726 N 4th St
- 106 Fireside Ct
- Lot 7 & 8 Crescent Hills Dr
- 540 Jonathan Ln
- 0 Crescent Hills Dr
- 0 Hill St N
- 512 N Hill St
- 28 N Walnut St
- 813 Stoney Point Rd
- 220 S Maple St
- 428 Backstretch Ct
- 604 Hickory Ct
- 0 County Road 6 Unit 1941351
- 0 Hickory Ln
- 906 Redwood St E
- 912 S Oak St
- 32979 County Road 1
- 1626 Lakeshore Dr
- 1608 Caroline St
- 224 Red Apple Dr
- 232 Red Apple Dr
- 236 Red Apple Dr
- 237 Red Apple Dr
- 220 Red Apple Dr
- 243 Red Apple Dr
- 235 Red Apple Dr
- 240 Red Apple Dr
- 249 Red Apple Dr
- 112 Red Apple Dr
- 255 Red Apple Dr
- 244 Red Apple Dr
- 203 Red Apple Dr
- 520 Regent Dr
- 516 Regent Dr
- 524 Regent Dr
- 1014 Jonathan Ln
- 1012 Jonathan Ln
- 530 Regent Dr
- 261 Red Apple Dr