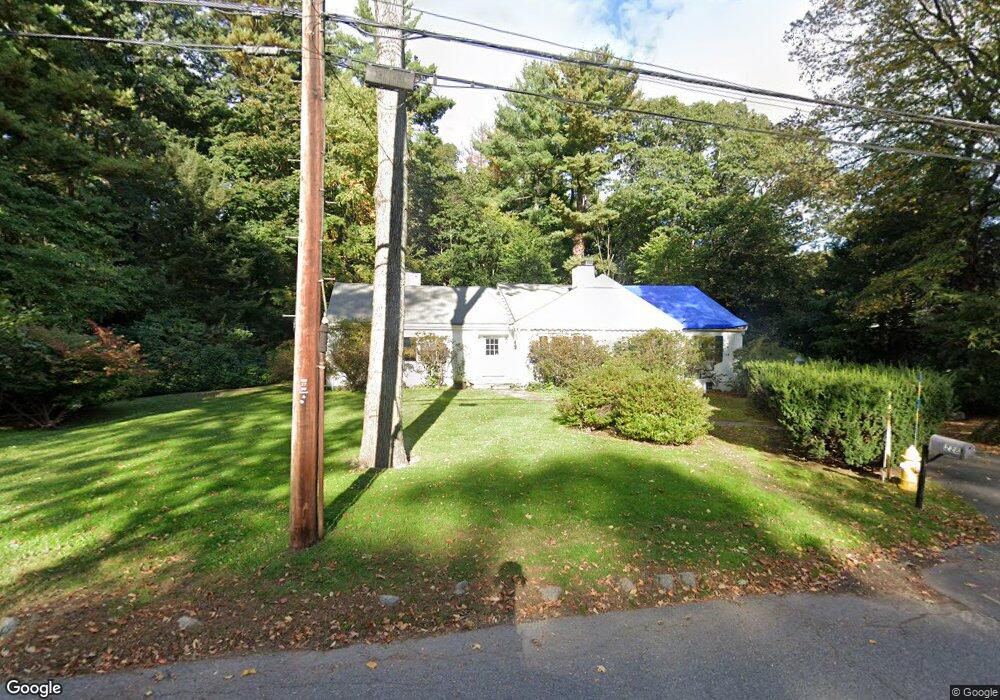
228 Ridgeway Rd Weston, MA 02493
Estimated Value: $1,487,000 - $2,053,000
3
Beds
2
Baths
2,070
Sq Ft
$798/Sq Ft
Est. Value
About This Home
This home is located at 228 Ridgeway Rd, Weston, MA 02493 and is currently estimated at $1,651,166, approximately $797 per square foot. 228 Ridgeway Rd is a home located in Middlesex County with nearby schools including Country Elementary School, Woodland Elementary School, and Field Elementary School.
Ownership History
Date
Name
Owned For
Owner Type
Purchase Details
Closed on
Feb 21, 2025
Sold by
Peter Annika Llc
Bought by
228 Ridgeway Dev Llc
Current Estimated Value
Purchase Details
Closed on
Aug 1, 2006
Sold by
Kjell G Holmquist T G and Kjell Holmquist
Bought by
Peter Annika Llc
Create a Home Valuation Report for This Property
The Home Valuation Report is an in-depth analysis detailing your home's value as well as a comparison with similar homes in the area
Home Values in the Area
Average Home Value in this Area
Purchase History
| Date | Buyer | Sale Price | Title Company |
|---|---|---|---|
| 228 Ridgeway Dev Llc | $1,450,000 | None Available | |
| 228 Ridgeway Dev Llc | $1,450,000 | None Available | |
| Peter Annika Llc | -- | -- | |
| Peter Annika Llc | -- | -- |
Source: Public Records
Mortgage History
| Date | Status | Borrower | Loan Amount |
|---|---|---|---|
| Previous Owner | Peter Annika Llc | $100,000 |
Source: Public Records
Tax History
| Year | Tax Paid | Tax Assessment Tax Assessment Total Assessment is a certain percentage of the fair market value that is determined by local assessors to be the total taxable value of land and additions on the property. | Land | Improvement |
|---|---|---|---|---|
| 2025 | $14,597 | $1,315,000 | $952,000 | $363,000 |
| 2024 | $13,936 | $1,253,200 | $952,000 | $301,200 |
| 2023 | $14,204 | $1,199,700 | $952,000 | $247,700 |
| 2022 | $13,700 | $1,069,500 | $894,000 | $175,500 |
| 2021 | $8 | $1,019,200 | $851,900 | $167,300 |
| 2020 | $13,076 | $1,019,200 | $851,900 | $167,300 |
| 2019 | $12,089 | $960,200 | $794,800 | $165,400 |
| 2018 | $3,852 | $960,800 | $794,800 | $166,000 |
| 2017 | $11,914 | $960,800 | $794,800 | $166,000 |
| 2016 | $11,683 | $960,800 | $794,800 | $166,000 |
| 2015 | $11,273 | $918,000 | $756,900 | $161,100 |
Source: Public Records
Map
Nearby Homes
Your Personal Tour Guide
Ask me questions while you tour the home.