Estimated Value: $130,000 - $178,246
3
Beds
2
Baths
1,550
Sq Ft
$100/Sq Ft
Est. Value
About This Home
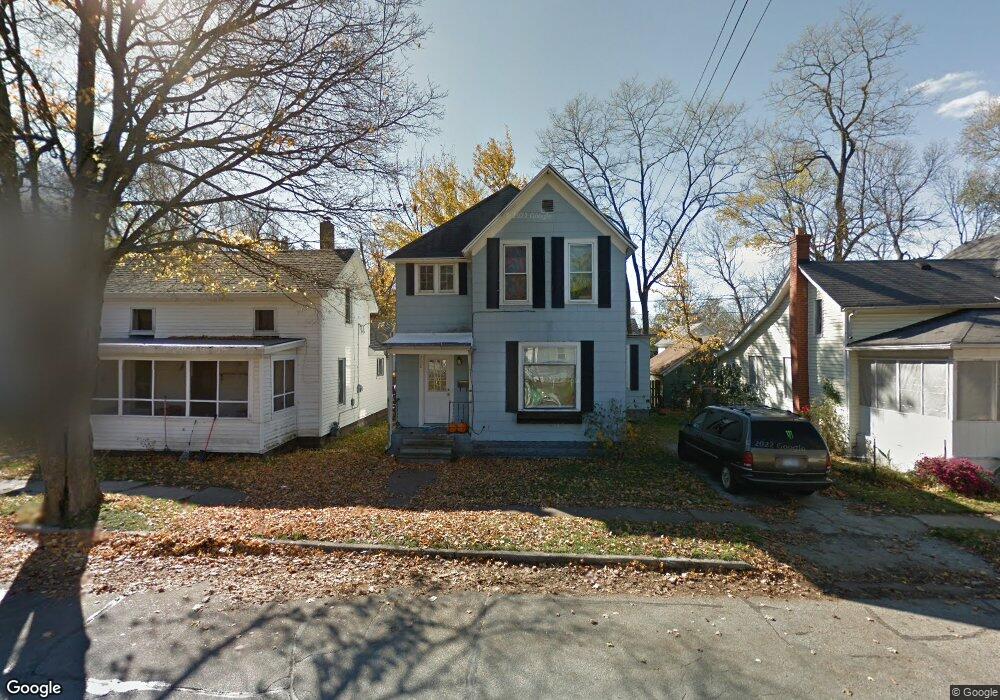
This home is located at 228 S 5th St, Niles, MI 49120 and is currently estimated at $154,562, approximately $99 per square foot. 228 S 5th St is a home located in Berrien County with nearby schools including Ballard Elementary School, Oak Manor Sixth Grade Center, and Ring Lardner Middle School.
Ownership History
Date
Name
Owned For
Owner Type
Purchase Details
Closed on
Apr 23, 2018
Sold by
Richardson Raymond
Bought by
Coulttes Randolph C and Folwer Randolph Clare
Current Estimated Value
Home Financials for this Owner
Home Financials are based on the most recent Mortgage that was taken out on this home.
Original Mortgage
$50,000
Outstanding Balance
$36,368
Interest Rate
4.45%
Mortgage Type
Credit Line Revolving
Estimated Equity
$118,194
Purchase Details
Closed on
Aug 15, 2007
Sold by
Fannie Mae
Bought by
Richardson Raymond and Richardson Lori A
Purchase Details
Closed on
Sep 19, 2006
Sold by
Trustcorp Mortgage Corp
Bought by
Federal National Mortgage Association
Purchase Details
Closed on
Aug 17, 2006
Sold by
Babcock Christina
Bought by
Trustcorp Mortgage Corp
Purchase Details
Closed on
Apr 2, 1998
Purchase Details
Closed on
Nov 10, 1994
Purchase Details
Closed on
Nov 4, 1993
Purchase Details
Closed on
Sep 30, 1986
Purchase Details
Closed on
Nov 29, 1973
Create a Home Valuation Report for This Property
The Home Valuation Report is an in-depth analysis detailing your home's value as well as a comparison with similar homes in the area
Home Values in the Area
Average Home Value in this Area
Purchase History
| Date | Buyer | Sale Price | Title Company |
|---|---|---|---|
| Coulttes Randolph C | $29,000 | None Available | |
| Richardson Raymond | $19,500 | Meridian Title Corp | |
| Federal National Mortgage Association | -- | None Available | |
| Trustcorp Mortgage Corp | $50,283 | None Available | |
| -- | $46,900 | -- | |
| -- | $25,000 | -- | |
| -- | $10,300 | -- | |
| -- | $13,900 | -- | |
| -- | -- | -- |
Source: Public Records
Mortgage History
| Date | Status | Borrower | Loan Amount |
|---|---|---|---|
| Open | Coulttes Randolph C | $50,000 |
Source: Public Records
Tax History
| Year | Tax Paid | Tax Assessment Tax Assessment Total Assessment is a certain percentage of the fair market value that is determined by local assessors to be the total taxable value of land and additions on the property. | Land | Improvement |
|---|---|---|---|---|
| 2025 | $1,559 | $84,700 | $0 | $0 |
| 2024 | $1,226 | $78,600 | $0 | $0 |
| 2023 | $1,175 | $68,700 | $0 | $0 |
| 2022 | $1,119 | $63,700 | $0 | $0 |
| 2021 | $1,372 | $59,500 | $2,800 | $56,700 |
| 2020 | $1,357 | $47,400 | $0 | $0 |
| 2019 | $1,340 | $36,200 | $7,700 | $28,500 |
| 2018 | $1,073 | $36,200 | $0 | $0 |
| 2017 | $2,112 | $32,200 | $0 | $0 |
| 2016 | $2,067 | $30,400 | $0 | $0 |
| 2015 | $2,061 | $27,300 | $0 | $0 |
| 2014 | $764 | $27,100 | $0 | $0 |
Source: Public Records
Map
Nearby Homes
Your Personal Tour Guide
Ask me questions while you tour the home.