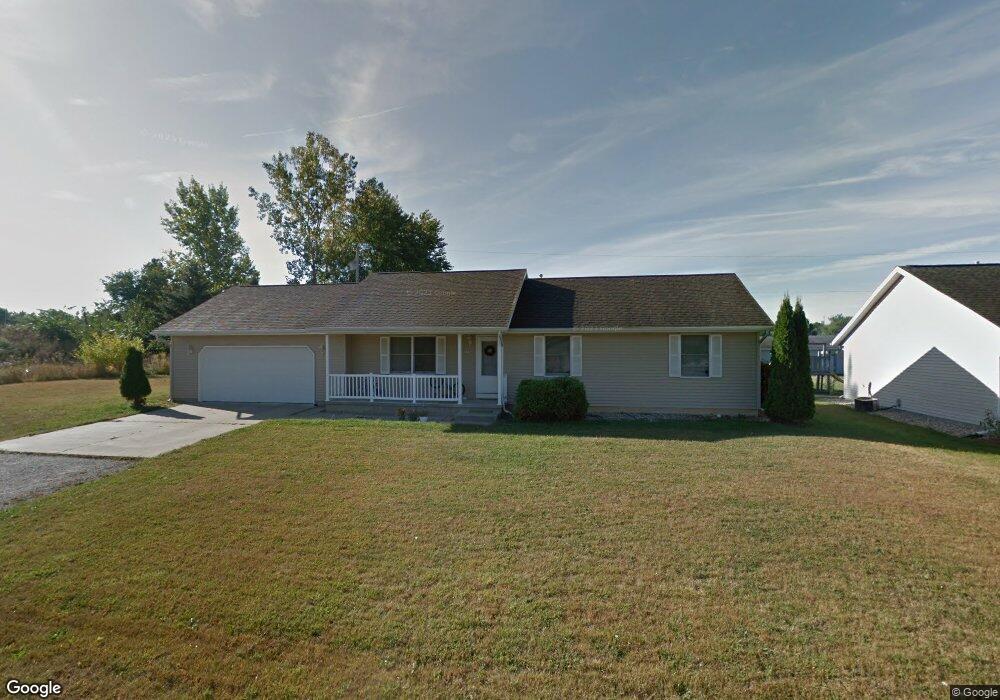
228 Todd St Topeka, IN 46571
Estimated Value: $241,000 - $273,000
3
Beds
2
Baths
1,204
Sq Ft
$212/Sq Ft
Est. Value
About This Home
This home is located at 228 Todd St, Topeka, IN 46571 and is currently estimated at $255,150, approximately $211 per square foot. 228 Todd St is a home with nearby schools including Topeka Elementary School, Westview Elementary School, and Westview Junior/Senior High School.
Ownership History
Date
Name
Owned For
Owner Type
Purchase Details
Closed on
Mar 30, 2018
Sold by
Russell Shaffer
Bought by
Mcintosh Paul A
Current Estimated Value
Home Financials for this Owner
Home Financials are based on the most recent Mortgage that was taken out on this home.
Original Mortgage
$112,365
Outstanding Balance
$96,497
Interest Rate
4.38%
Mortgage Type
VA
Estimated Equity
$158,653
Purchase Details
Closed on
Jul 1, 2010
Sold by
Russell L Shaffer
Bought by
Mcintosh Paul A and Mc Intosh Christine M
Create a Home Valuation Report for This Property
The Home Valuation Report is an in-depth analysis detailing your home's value as well as a comparison with similar homes in the area
Home Values in the Area
Average Home Value in this Area
Purchase History
| Date | Buyer | Sale Price | Title Company |
|---|---|---|---|
| Mcintosh Paul A | $110,118 | Attorney Only | |
| Mcintosh Paul A | $120,000 | -- |
Source: Public Records
Mortgage History
| Date | Status | Borrower | Loan Amount |
|---|---|---|---|
| Open | Mcintosh Paul A | $112,365 |
Source: Public Records
Tax History Compared to Growth
Tax History
| Year | Tax Paid | Tax Assessment Tax Assessment Total Assessment is a certain percentage of the fair market value that is determined by local assessors to be the total taxable value of land and additions on the property. | Land | Improvement |
|---|---|---|---|---|
| 2024 | $2,128 | $210,000 | $27,800 | $182,200 |
| 2023 | $1,813 | $202,900 | $25,300 | $177,600 |
| 2022 | $1,572 | $165,900 | $22,000 | $143,900 |
| 2021 | $1,562 | $154,400 | $20,000 | $134,400 |
| 2020 | $1,396 | $140,500 | $18,500 | $122,000 |
| 2019 | $3,163 | $138,800 | $18,500 | $120,300 |
| 2018 | $1,089 | $139,100 | $18,500 | $120,600 |
| 2017 | $1,044 | $133,400 | $18,500 | $114,900 |
| 2016 | $1,227 | $131,500 | $18,500 | $113,000 |
| 2014 | $1,119 | $121,000 | $18,500 | $102,500 |
| 2013 | $1,119 | $122,100 | $18,500 | $103,600 |
Source: Public Records
Map
Nearby Homes