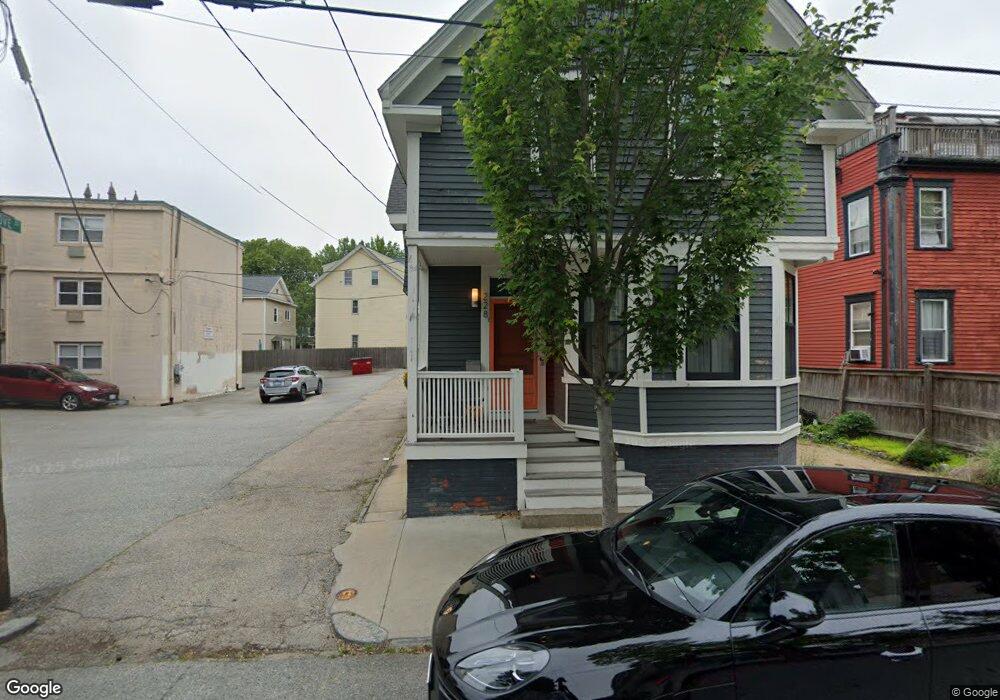
228 Transit St Providence, RI 02906
Fox Point NeighborhoodEstimated Value: $630,000 - $907,000
4
Beds
2
Baths
1,318
Sq Ft
$561/Sq Ft
Est. Value
About This Home
This home is located at 228 Transit St, Providence, RI 02906 and is currently estimated at $738,789, approximately $560 per square foot. 228 Transit St is a home located in Providence County with nearby schools including French-American School of Rhode Island, Wheeler School, and Moses Brown School.
Ownership History
Date
Name
Owned For
Owner Type
Purchase Details
Closed on
Dec 2, 2009
Sold by
Egan William R
Bought by
Haskett Joseph H and Murphy Kirsten
Current Estimated Value
Home Financials for this Owner
Home Financials are based on the most recent Mortgage that was taken out on this home.
Original Mortgage
$220,000
Interest Rate
5.01%
Mortgage Type
Purchase Money Mortgage
Create a Home Valuation Report for This Property
The Home Valuation Report is an in-depth analysis detailing your home's value as well as a comparison with similar homes in the area
Home Values in the Area
Average Home Value in this Area
Purchase History
| Date | Buyer | Sale Price | Title Company |
|---|---|---|---|
| Haskett Joseph H | $147,500 | -- |
Source: Public Records
Mortgage History
| Date | Status | Borrower | Loan Amount |
|---|---|---|---|
| Open | Haskett Joseph H | $215,000 | |
| Closed | Haskett Joseph H | $220,000 | |
| Previous Owner | Haskett Joseph H | $20,000 |
Source: Public Records
Tax History
| Year | Tax Paid | Tax Assessment Tax Assessment Total Assessment is a certain percentage of the fair market value that is determined by local assessors to be the total taxable value of land and additions on the property. | Land | Improvement |
|---|---|---|---|---|
| 2025 | $5,562 | $662,200 | $425,500 | $236,700 |
| 2024 | $9,445 | $514,700 | $324,900 | $189,800 |
| 2023 | $9,445 | $514,700 | $324,900 | $189,800 |
| 2022 | $9,162 | $514,700 | $324,900 | $189,800 |
| 2021 | $8,198 | $333,800 | $206,100 | $127,700 |
| 2020 | $8,198 | $333,800 | $206,100 | $127,700 |
| 2019 | $8,198 | $333,800 | $206,100 | $127,700 |
| 2018 | $7,990 | $250,000 | $190,000 | $60,000 |
| 2017 | $7,990 | $250,000 | $190,000 | $60,000 |
| 2016 | $7,990 | $250,000 | $190,000 | $60,000 |
| 2015 | $8,199 | $247,700 | $190,000 | $57,700 |
| 2014 | $8,360 | $247,700 | $190,000 | $57,700 |
| 2013 | $8,360 | $247,700 | $190,000 | $57,700 |
Source: Public Records
Map
Nearby Homes
- 20 Governor St
- 16 Governor St
- 427 Wickenden St
- 374 Wickenden St
- 323 Wickenden St
- 42 E Transit St
- 42 Fremont St
- 73 Trenton St
- 670 Wickenden St
- 14 Amy St
- 18 Amy St
- 45 E George St
- 555 S Main St Unit 321
- 38 Transit St Unit 3
- 555 S Water St Unit 212
- 388 S Main St Unit 66
- 124 Pitman St
- 400 Angell St
- 20 Taber Ave
- 99 1st St
- 23 East St
- 25 East St
- 21 East St
- 82 Arnold St
- 19 East St
- 223 Transit St
- 27 East St
- 27 East St Unit 1
- 27 East St Unit 3
- 27 East St Unit 2
- 77 Hope St Unit 6
- 77 Hope St Unit 15
- 77 Hope St Unit 12
- 77 Hope St Unit 16
- 77 Hope St Unit 10
- 77 Hope St Unit 11
- 77 Hope St Unit 7
- 77 Hope St Unit 18
- 77 Hope St Unit 17
- 77 Hope St Unit 14
Your Personal Tour Guide
Ask me questions while you tour the home.