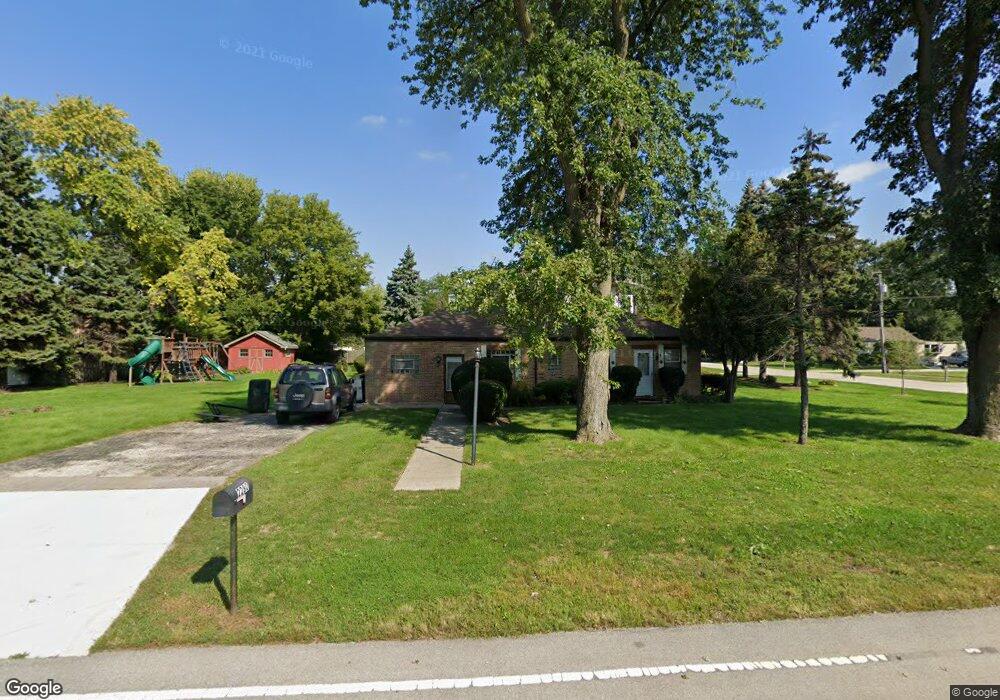
2280 Douglas Ave Des Plaines, IL 60018
Estimated Value: $339,735 - $383,000
2
Beds
1
Bath
1,152
Sq Ft
$315/Sq Ft
Est. Value
About This Home
This home is located at 2280 Douglas Ave, Des Plaines, IL 60018 and is currently estimated at $363,184, approximately $315 per square foot. 2280 Douglas Ave is a home located in Cook County with nearby schools including Plainfield Elementary School, Algonquin Middle School, and Maine West High School.
Ownership History
Date
Name
Owned For
Owner Type
Purchase Details
Closed on
Sep 28, 2020
Sold by
Donovan Ralph H and Donovan Ramona L
Bought by
Delgado Victor E
Current Estimated Value
Home Financials for this Owner
Home Financials are based on the most recent Mortgage that was taken out on this home.
Original Mortgage
$156,000
Outstanding Balance
$137,493
Interest Rate
2.9%
Mortgage Type
New Conventional
Estimated Equity
$225,691
Purchase Details
Closed on
Dec 6, 2000
Sold by
Donovan Ralph H
Bought by
Donovan Ralph H and Donovan Ramona L
Home Financials for this Owner
Home Financials are based on the most recent Mortgage that was taken out on this home.
Original Mortgage
$117,400
Interest Rate
7.8%
Purchase Details
Closed on
Oct 2, 1995
Sold by
Chicago Title & Trust Company
Bought by
Donovan Ralph H
Create a Home Valuation Report for This Property
The Home Valuation Report is an in-depth analysis detailing your home's value as well as a comparison with similar homes in the area
Home Values in the Area
Average Home Value in this Area
Purchase History
| Date | Buyer | Sale Price | Title Company |
|---|---|---|---|
| Delgado Victor E | $195,000 | Attorneys Ttl Guaranty Fund | |
| Donovan Ralph H | -- | -- | |
| Donovan Ralph H | $140,000 | -- |
Source: Public Records
Mortgage History
| Date | Status | Borrower | Loan Amount |
|---|---|---|---|
| Open | Delgado Victor E | $156,000 | |
| Previous Owner | Donovan Ralph H | $117,400 |
Source: Public Records
Tax History
| Year | Tax Paid | Tax Assessment Tax Assessment Total Assessment is a certain percentage of the fair market value that is determined by local assessors to be the total taxable value of land and additions on the property. | Land | Improvement |
|---|---|---|---|---|
| 2025 | $5,190 | $28,001 | $6,902 | $21,099 |
| 2024 | $5,190 | $23,000 | $5,981 | $17,019 |
| 2023 | $5,038 | $23,000 | $5,981 | $17,019 |
| 2022 | $5,038 | $23,000 | $5,981 | $17,019 |
| 2021 | $3,699 | $15,365 | $7,821 | $7,544 |
| 2020 | $4,643 | $15,365 | $7,821 | $7,544 |
| 2019 | $4,646 | $17,265 | $7,821 | $9,444 |
| 2018 | $5,113 | $17,096 | $6,901 | $10,195 |
| 2017 | $5,022 | $17,096 | $6,901 | $10,195 |
| 2016 | $4,751 | $17,096 | $6,901 | $10,195 |
| 2015 | $3,991 | $13,200 | $5,981 | $7,219 |
| 2014 | $3,906 | $13,200 | $5,981 | $7,219 |
| 2013 | $3,809 | $13,200 | $5,981 | $7,219 |
Source: Public Records
Map
Nearby Homes
- 2323 Douglas Ave
- 635 Birchwood Ave
- 614 Birchwood Ave
- 805 S Tures Ln
- 1370 Fargo Ave Unit E
- 815 E Oakton St Unit 311
- 664 E Oakton St
- 1738 Lunt Ave
- 1596 Oxford Rd
- 1541 Cooper St
- 1629 E Touhy Ave
- 1641 E Touhy Ave
- 1445 Everett Ave
- 1458 Kingston Ct
- 1080 Bogart St
- 1030 Bogart St
- 505 Forest Ave
- 1394 Carol Ln
- 1689 S Elm St
- 1757 Farwell Ave
- 2274 Douglas Ave
- 2268 Douglas Ave
- 2281 Sprucewood Ave
- 2275 Sprucewood Ave
- 755 Jarlath Ave
- 655 Jarlath Ave
- 745 Jarlath Ave
- 2264 Douglas Ave
- 2273 Sprucewood Ave
- 653 Jarlath Ave
- 2293 Douglas Ave
- 2281 Douglas Ave
- 2319 Douglas Ave
- 2271 Sprucewood Ave
- 2260 Douglas Ave
- 635 Jarlath Ave
- 2269 Douglas Ave
- 2267 Sprucewood Ave
- 2256 Douglas Ave
- 2337 Douglas Ave
Your Personal Tour Guide
Ask me questions while you tour the home.