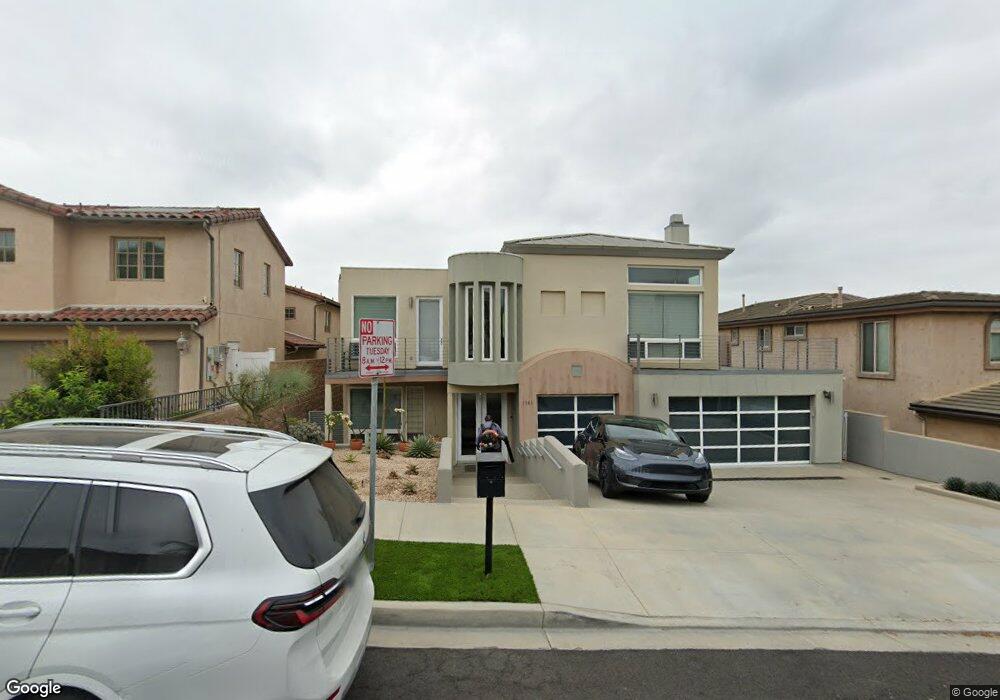
2280 Ohio Ave Signal Hill, CA 90755
Estimated Value: $1,549,000 - $1,830,000
4
Beds
5
Baths
4,162
Sq Ft
$415/Sq Ft
Est. Value
About This Home
This home is located at 2280 Ohio Ave, Signal Hill, CA 90755 and is currently estimated at $1,728,402, approximately $415 per square foot. 2280 Ohio Ave is a home located in Los Angeles County with nearby schools including Signal Hill Elementary School, Nelson Academy, and Woodrow Wilson High School.
Ownership History
Date
Name
Owned For
Owner Type
Purchase Details
Closed on
Apr 3, 2017
Sold by
Tegel
Bought by
Tegel
Current Estimated Value
Home Financials for this Owner
Home Financials are based on the most recent Mortgage that was taken out on this home.
Interest Rate
4.14%
Purchase Details
Closed on
Mar 10, 2016
Sold by
Patel Rajanikant N
Bought by
Patel Family Revocable Trust
Purchase Details
Closed on
Apr 20, 2007
Sold by
Patel Balubhai Gopalji
Bought by
Patel Rajanikant N and Patel Alkakumari
Purchase Details
Closed on
Mar 1, 2007
Sold by
Papadakis George E and Papadakis Colleen
Bought by
Patel Balubhai Gopalji
Purchase Details
Closed on
Apr 29, 2005
Sold by
Papadakis George E and Papadakis Colleen
Bought by
Papadakis George E and Papadakis Colleen
Purchase Details
Closed on
Nov 7, 2003
Sold by
Barto Craig C and Barto Gisele M
Bought by
Papadakis George E and Papadakis Colleen
Create a Home Valuation Report for This Property
The Home Valuation Report is an in-depth analysis detailing your home's value as well as a comparison with similar homes in the area
Home Values in the Area
Average Home Value in this Area
Purchase History
| Date | Buyer | Sale Price | Title Company |
|---|---|---|---|
| Tegel | -- | -- | |
| Patel Family Revocable Trust | -- | None Available | |
| Patel Rajanikant N | -- | Fidelity National Title | |
| Patel Balubhai Gopalji | -- | Fidelity National Title | |
| Papadakis George E | -- | None Available | |
| Papadakis George E | -- | First American Title Ins Co |
Source: Public Records
Mortgage History
| Date | Status | Borrower | Loan Amount |
|---|---|---|---|
| Closed | Tegel | -- |
Source: Public Records
Tax History Compared to Growth
Tax History
| Year | Tax Paid | Tax Assessment Tax Assessment Total Assessment is a certain percentage of the fair market value that is determined by local assessors to be the total taxable value of land and additions on the property. | Land | Improvement |
|---|---|---|---|---|
| 2025 | $14,935 | $1,155,704 | $627,994 | $527,710 |
| 2024 | $14,935 | $1,133,044 | $615,681 | $517,363 |
| 2023 | $14,694 | $1,110,828 | $603,609 | $507,219 |
| 2022 | $13,807 | $1,089,048 | $591,774 | $497,274 |
| 2021 | $13,532 | $1,067,695 | $580,171 | $487,524 |
| 2019 | $13,340 | $1,036,029 | $562,964 | $473,065 |
| 2018 | $12,897 | $1,015,716 | $551,926 | $463,790 |
| 2016 | $11,857 | $976,277 | $530,495 | $445,782 |
| 2015 | $11,389 | $961,613 | $522,527 | $439,086 |
| 2014 | $11,302 | $942,777 | $512,292 | $430,485 |
Source: Public Records
Map
Nearby Homes
- 2700 E Panorama Dr Unit 402
- 2215 Molino Ave Unit C
- 2240 Stanley Ave Unit 5
- 2199 Ohio Ave
- 2150 Ohio Ave Unit E
- 2501 Temple Ave
- 2205 Starlight Ln
- 2071 Crescent Dr
- 2125 Ridgeview Terrace Dr
- 2722 E 20th St Unit 104
- 1994 Stanley Ave
- 1988 Junipero Ave
- 2231 Saint Louis Ave Unit 101B
- 2240 N Legion Dr Unit 217
- 2298 Rose Ave Unit 110
- 3247 E Grant St
- 2720 E Wall St
- 1965 Saint Louis Ave
- 3416 Hathaway Ave Unit 118
- 3456 Hathaway Ave Unit 338
- 2700 Skyline Dr
- 2270 Ohio Ave
- 2260 Ohio Ave
- 2250 Ohio Ave
- 2281 Ohio Ave
- 2285 Ohio Ave
- 2650 Skyline Dr
- 2271 Ohio Ave
- 2275 Ohio Ave Unit 2
- 2273 Ohio Ave
- 2275 Ohio Ave
- 2277 Ohio Ave
- 2267 Ohio Ave
- 2263 Ohio Ave
- 2700 E Panorama Dr Unit 304
- 2700 E Panorama Dr Unit 405
- 2700 E Panorama Dr Unit 404
- 2700 E Panorama Dr Unit 403
- 2700 E Panorama Dr Unit 401
- 2700 E Panorama Dr Unit 310