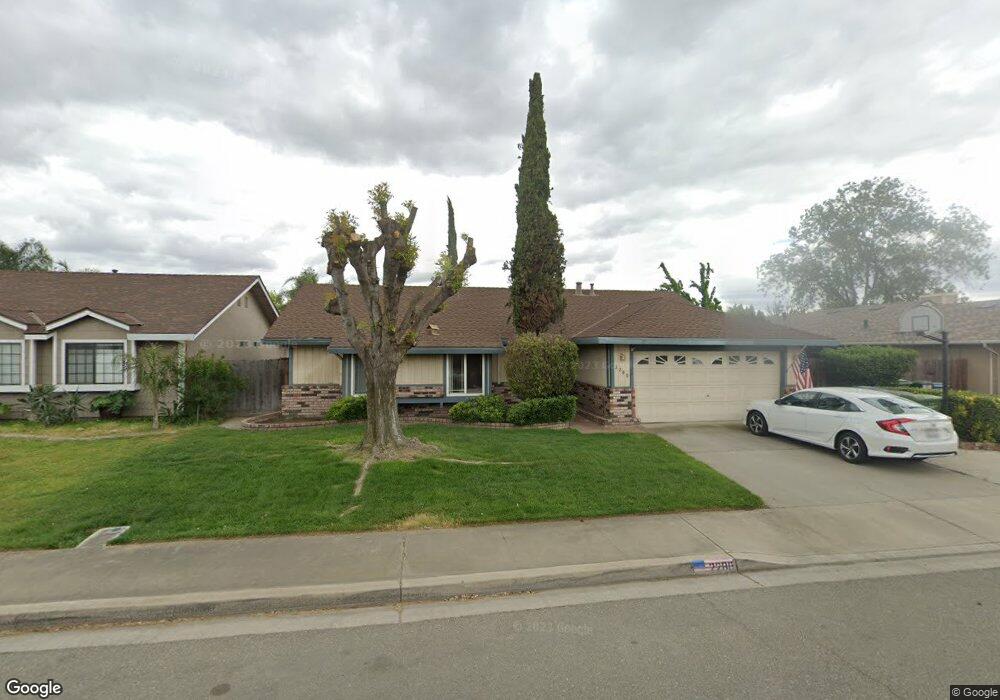
2280 Roth Way Turlock, CA 95380
Estimated Value: $447,000 - $481,000
3
Beds
2
Baths
1,540
Sq Ft
$297/Sq Ft
Est. Value
About This Home
This home is located at 2280 Roth Way, Turlock, CA 95380 and is currently estimated at $457,834, approximately $297 per square foot. 2280 Roth Way is a home located in Stanislaus County with nearby schools including Crowell Elementary School, Marvin A. Dutcher Middle School, and Turlock Junior High School.
Ownership History
Date
Name
Owned For
Owner Type
Purchase Details
Closed on
Feb 28, 2022
Sold by
Tejeda Saldana Beatriz
Bought by
Saldana Beatriz Tejada
Current Estimated Value
Purchase Details
Closed on
Sep 3, 2021
Sold by
Tejeda Angel
Bought by
Tejeda Angel and Saldana Beatriz Tejeda
Purchase Details
Closed on
Nov 6, 2001
Sold by
Elliott Stephen F and Elliott Stacey L
Bought by
Tejeda Angel
Home Financials for this Owner
Home Financials are based on the most recent Mortgage that was taken out on this home.
Original Mortgage
$152,840
Interest Rate
6.63%
Mortgage Type
FHA
Purchase Details
Closed on
Jun 20, 1995
Sold by
Decouto Fernando R and Decouto Melinda L
Bought by
Elliott Stephen F and Elliott Stacey L
Home Financials for this Owner
Home Financials are based on the most recent Mortgage that was taken out on this home.
Original Mortgage
$112,270
Interest Rate
7.62%
Mortgage Type
FHA
Create a Home Valuation Report for This Property
The Home Valuation Report is an in-depth analysis detailing your home's value as well as a comparison with similar homes in the area
Purchase History
| Date | Buyer | Sale Price | Title Company |
|---|---|---|---|
| Saldana Beatriz Tejada | -- | None Listed On Document | |
| Tejeda Angel | -- | None Listed On Document | |
| Tejeda Angel | $155,000 | Chicago Title Co | |
| Elliott Stephen F | $113,000 | Fidelity National Title |
Source: Public Records
Mortgage History
| Date | Status | Borrower | Loan Amount |
|---|---|---|---|
| Previous Owner | Tejeda Angel | $152,840 | |
| Previous Owner | Elliott Stephen F | $112,270 | |
| Closed | Tejeda Angel | $9,300 |
Source: Public Records
Tax History Compared to Growth
Tax History
| Year | Tax Paid | Tax Assessment Tax Assessment Total Assessment is a certain percentage of the fair market value that is determined by local assessors to be the total taxable value of land and additions on the property. | Land | Improvement |
|---|---|---|---|---|
| 2025 | $4,752 | $443,053 | $222,853 | $220,200 |
| 2024 | $4,663 | $434,367 | $218,484 | $215,883 |
| 2023 | $4,656 | $425,850 | $214,200 | $211,650 |
| 2022 | $2,301 | $215,756 | $62,635 | $153,121 |
| 2021 | $2,266 | $211,526 | $61,407 | $150,119 |
| 2020 | $2,250 | $209,358 | $60,778 | $148,580 |
| 2019 | $2,210 | $205,254 | $59,587 | $145,667 |
| 2018 | $2,207 | $201,230 | $58,419 | $142,811 |
| 2017 | $2,154 | $197,285 | $57,274 | $140,011 |
| 2016 | $2,010 | $193,417 | $56,151 | $137,266 |
| 2015 | $1,992 | $190,513 | $55,308 | $135,205 |
| 2014 | $1,971 | $186,782 | $54,225 | $132,557 |
Source: Public Records
Map
Nearby Homes
- 2450 Fulkerth Rd
- 2400 Fulkerth Rd
- 1357 Mark Ct
- 2065 Cody Ct
- 2230 Aspenwood Dr
- 961 Countryside Dr
- 2631 Polous Dr
- 1760 Blevins Ct
- 1400 N Tully Rd Unit 120
- 1400 N Tully Rd Unit 187
- 1400 N Tully Rd Unit 137
- 1400 N Tully Rd Unit 91
- 1051 Hysell Ct
- 2226 Typhoon Ct
- 1330 Dianne Dr
- 500 N Tully Rd Unit 39
- 500 N Tully Rd
- 1259 Joett Dr
- 1947 Shadow Park Dr
- 3000 W Tuolumne Rd
- 2260 Roth Way
- 1490 Countryside Dr
- 1440 Countryside Dr
- 1441 Mustang Ct
- 2240 Roth Way
- 2295 Roth Way
- 1503 Mallard Ct
- 1427 Mustang Ct
- 1426 Countryside Dr
- 1495 Countryside Dr
- 2230 Roth Way
- 1499 Countryside Dr
- 1440 Mustang Ct
- 1441 Countryside Dr
- 1505 Countryside Dr
- 1520 Countryside Dr
- 1523 Mallard Ct
- 2235 Roth Way
- 1412 Countryside Dr
- 1413 Mustang Ct