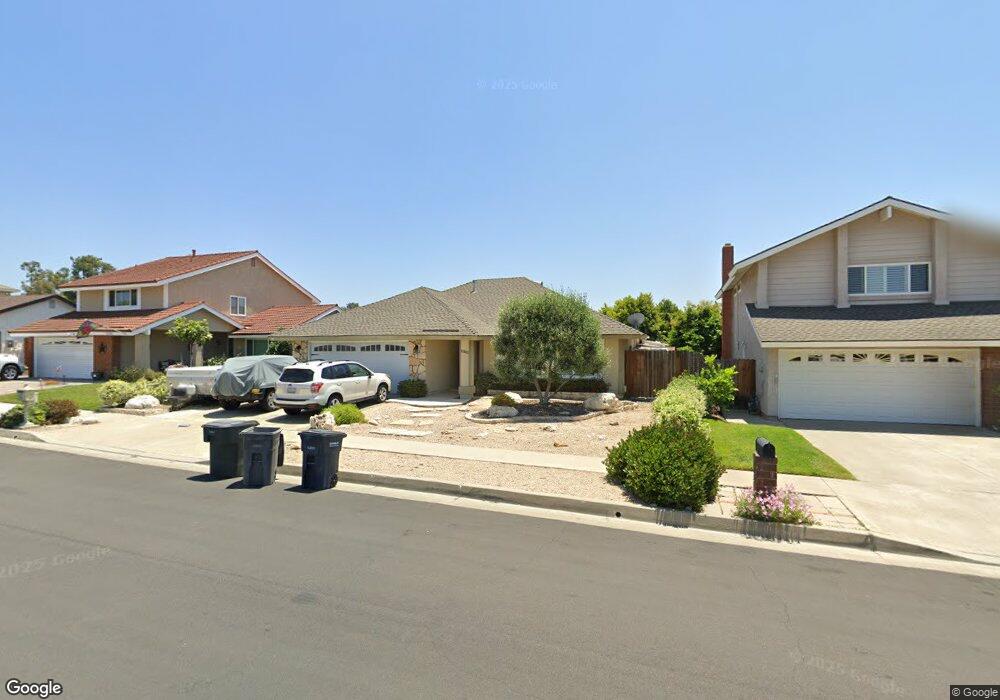
22802 Foxborough Way Lake Forest, CA 92630
Estimated Value: $1,006,000 - $1,172,000
3
Beds
2
Baths
1,329
Sq Ft
$841/Sq Ft
Est. Value
About This Home
This home is located at 22802 Foxborough Way, Lake Forest, CA 92630 and is currently estimated at $1,117,063, approximately $840 per square foot. 22802 Foxborough Way is a home located in Orange County with nearby schools including La Madera Elementary School, Los Alisos Intermediate School, and El Toro High School.
Ownership History
Date
Name
Owned For
Owner Type
Purchase Details
Closed on
Jun 13, 2012
Sold by
Greeley Cortlend D and Greeley Sharon L
Bought by
Greeley Cortlend D and Greeley Sharon L
Current Estimated Value
Purchase Details
Closed on
Mar 9, 1994
Sold by
Annesi John Michael
Bought by
Greeley Cortlend D and Greeley Sharon L
Home Financials for this Owner
Home Financials are based on the most recent Mortgage that was taken out on this home.
Original Mortgage
$184,000
Interest Rate
7.67%
Mortgage Type
VA
Purchase Details
Closed on
Sep 24, 1993
Sold by
Annesi John M
Bought by
Annesi John Michael
Home Financials for this Owner
Home Financials are based on the most recent Mortgage that was taken out on this home.
Original Mortgage
$90,000
Interest Rate
6.87%
Create a Home Valuation Report for This Property
The Home Valuation Report is an in-depth analysis detailing your home's value as well as a comparison with similar homes in the area
Home Values in the Area
Average Home Value in this Area
Purchase History
| Date | Buyer | Sale Price | Title Company |
|---|---|---|---|
| Greeley Cortlend D | -- | None Available | |
| Greeley Cortlend D | $188,500 | Fidelity National Title Ins | |
| Annesi John Michael | -- | South Coast Title Company |
Source: Public Records
Mortgage History
| Date | Status | Borrower | Loan Amount |
|---|---|---|---|
| Previous Owner | Greeley Cortlend D | $184,000 | |
| Previous Owner | Annesi John Michael | $90,000 |
Source: Public Records
Tax History Compared to Growth
Tax History
| Year | Tax Paid | Tax Assessment Tax Assessment Total Assessment is a certain percentage of the fair market value that is determined by local assessors to be the total taxable value of land and additions on the property. | Land | Improvement |
|---|---|---|---|---|
| 2025 | $3,227 | $320,379 | $178,969 | $141,410 |
| 2024 | $3,227 | $314,098 | $175,460 | $138,638 |
| 2023 | $3,150 | $307,940 | $172,020 | $135,920 |
| 2022 | $3,093 | $301,902 | $168,647 | $133,255 |
| 2021 | $3,030 | $295,983 | $165,340 | $130,643 |
| 2020 | $3,002 | $292,949 | $163,645 | $129,304 |
| 2019 | $2,941 | $287,205 | $160,436 | $126,769 |
| 2018 | $2,885 | $281,574 | $157,290 | $124,284 |
| 2017 | $2,825 | $276,053 | $154,205 | $121,848 |
| 2016 | $2,778 | $270,641 | $151,182 | $119,459 |
| 2015 | $2,743 | $266,576 | $148,911 | $117,665 |
| 2014 | $2,682 | $261,355 | $145,994 | $115,361 |
Source: Public Records
Map
Nearby Homes
- 22718 Via Castilla
- 22962 Springwater
- 22862 Bonita Ln
- 25312 Pizarro Rd
- 22461 Silver Spur
- 25331 Via Viejo
- 26025 Via Pera Unit J3
- 26158 Via Pera Unit E4
- 26068 Via Pera
- 25614 Mont Pointe Unit 3D
- 25644 Mont Pointe Unit 1A
- 25885 Trabuco Rd Unit 206
- 25885 Trabuco Rd Unit 91
- 25885 Trabuco Rd Unit 306
- 25885 Trabuco Rd Unit 33
- 25885 Trabuco Rd Unit 226
- 25885 Trabuco Rd Unit 271
- 25631 Mont Pointe Unit 7D
- 133 Aliso Ridge Loop
- 22201 Center Pointe Unit 2D
- 22812 Foxborough Way
- 22792 Foxborough Way
- 22901 Broadleaf
- 22911 Broadleaf
- 22816 Foxborough Way
- 22895 Broadleaf
- 22782 Foxborough Way
- 22915 Broadleaf
- 22891 Broadleaf
- 22801 Foxborough Way
- 22791 Foxborough Way
- 22822 Foxborough Way
- 22921 Broadleaf
- 22776 Foxborough Way
- 22881 Broadleaf
- 22781 Foxborough Way
- 22832 Foxborough Way
- 22931 Broadleaf
- 25622 Dartmouth Cir
- 22875 Broadleaf