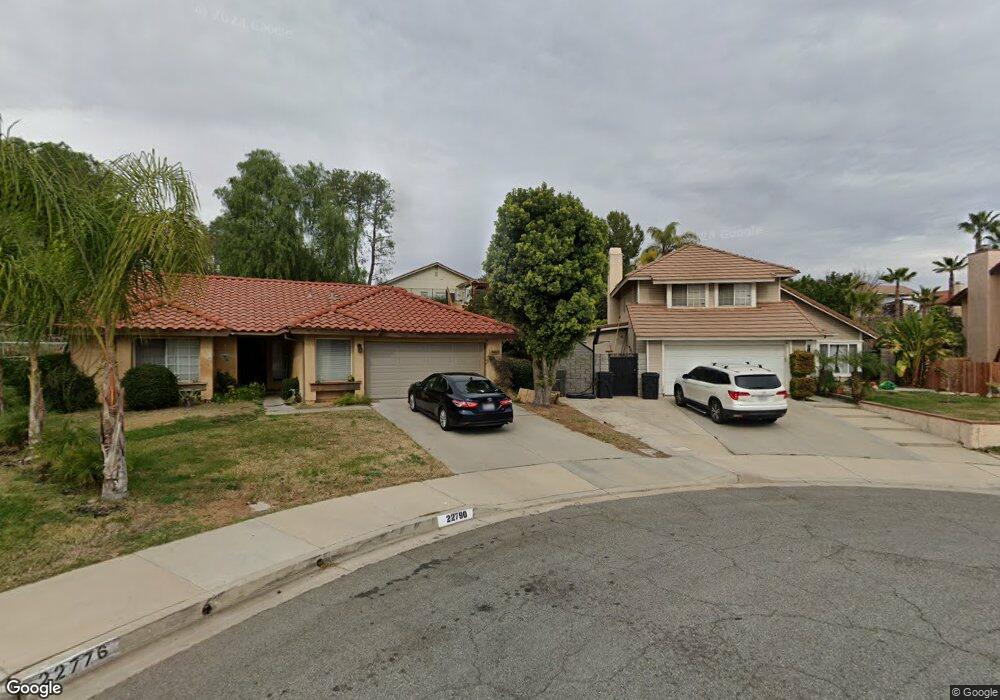
22804 Catmint Cir Moreno Valley, CA 92557
North Moreno Valley NeighborhoodEstimated Value: $584,000 - $638,000
5
Beds
3
Baths
1,944
Sq Ft
$316/Sq Ft
Est. Value
About This Home
This home is located at 22804 Catmint Cir, Moreno Valley, CA 92557 and is currently estimated at $615,052, approximately $316 per square foot. 22804 Catmint Cir is a home located in Riverside County with nearby schools including Box Springs Elementary School, Vista Heights Middle School, and Canyon Springs High School.
Ownership History
Date
Name
Owned For
Owner Type
Purchase Details
Closed on
Jul 1, 2010
Sold by
Montes Freddie
Bought by
Montes Freddie
Current Estimated Value
Purchase Details
Closed on
Aug 18, 2009
Sold by
Federal National Mortgage Association
Bought by
Montes Freddie
Home Financials for this Owner
Home Financials are based on the most recent Mortgage that was taken out on this home.
Original Mortgage
$191,468
Interest Rate
5.14%
Mortgage Type
FHA
Purchase Details
Closed on
Aug 12, 2008
Sold by
Mortgage Electronic Registration Systems
Bought by
Federal National Mortgage Association
Purchase Details
Closed on
Jun 20, 2005
Sold by
Pol Jose and Pol Zonia
Bought by
Rojero Jesus and Rojero Maria Jesus
Home Financials for this Owner
Home Financials are based on the most recent Mortgage that was taken out on this home.
Original Mortgage
$340,000
Interest Rate
4.8%
Mortgage Type
Purchase Money Mortgage
Create a Home Valuation Report for This Property
The Home Valuation Report is an in-depth analysis detailing your home's value as well as a comparison with similar homes in the area
Home Values in the Area
Average Home Value in this Area
Purchase History
| Date | Buyer | Sale Price | Title Company |
|---|---|---|---|
| Montes Freddie | -- | Stewart Title Of California | |
| Montes Freddie | -- | Stewart Title Of California | |
| Montes Freddie | $195,000 | Lsi Title Company | |
| Federal National Mortgage Association | -- | Fidelity Natl Title Ins Co | |
| Washington Mutual Bank | $372,574 | None Available | |
| Rojero Jesus | $425,000 | Investors Title Company |
Source: Public Records
Mortgage History
| Date | Status | Borrower | Loan Amount |
|---|---|---|---|
| Previous Owner | Montes Freddie | $191,468 | |
| Previous Owner | Rojero Jesus | $340,000 |
Source: Public Records
Tax History Compared to Growth
Tax History
| Year | Tax Paid | Tax Assessment Tax Assessment Total Assessment is a certain percentage of the fair market value that is determined by local assessors to be the total taxable value of land and additions on the property. | Land | Improvement |
|---|---|---|---|---|
| 2025 | $2,921 | $251,690 | $77,437 | $174,253 |
| 2023 | $2,921 | $241,919 | $74,431 | $167,488 |
| 2022 | $2,811 | $237,176 | $72,972 | $164,204 |
| 2021 | $2,759 | $232,527 | $71,542 | $160,985 |
| 2020 | $2,730 | $230,144 | $70,809 | $159,335 |
| 2019 | $2,686 | $225,632 | $69,421 | $156,211 |
| 2018 | $2,634 | $221,209 | $68,061 | $153,148 |
| 2017 | $2,577 | $216,873 | $66,727 | $150,146 |
| 2016 | $2,551 | $212,621 | $65,419 | $147,202 |
| 2015 | $2,554 | $209,430 | $64,438 | $144,992 |
| 2014 | $2,564 | $205,329 | $63,177 | $142,152 |
Source: Public Records
Map
Nearby Homes
- 22731 Tea Rose Ln
- 22713 Scotia Ln
- 22522 Sheffield Dr
- 11830 Carlisle Ct
- 11559 Parakeet Ct
- 11425 Tiffany Ln
- 11455 Pigeon Pass Rd
- 22564 Kinross Ln
- 23326 Elfin Place
- 12313 Timlico Ct
- 22600 Echo Lake Rd
- 23410 Woodlander Way
- 22086 Naples Dr
- 23402 Harland Dr
- 23540 Swan St
- 12579 Penske St
- 11412 Pickford Way
- 0 Olive Wood Plaza Dr
- 12045 Bayless St
- 11160 Pioneer Ridge Rd
- 22818 Catmint Cir
- 22790 Catmint Cir
- 22787 Wild Geranium Ln
- 22771 Wild Geranium Ln
- 22815 Wild Geranium Ln
- 22832 Catmint Cir
- 22755 Wild Geranium Ln
- 22753 Wild Geranium Ln
- 22831 Wild Geranium Ln
- 22776 Catmint Cir
- 22737 Wild Geranium Ln
- 22846 Catmint Cir
- 22813 Catmint Cir
- 22799 Catmint Cir
- 22785 Catmint Cir
- 22827 Catmint Cir
- 22851 Wild Geranium Ln
- 22721 Wild Geranium Ln
- 22841 Catmint Cir
- 22860 Catmint Cir