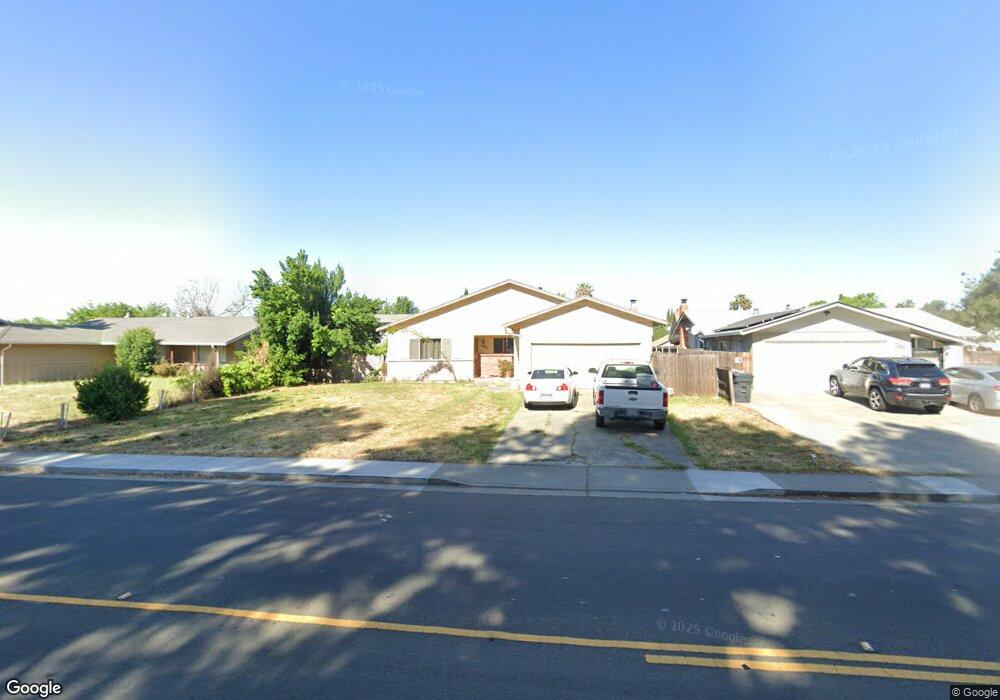
2281 Dover Ave Fairfield, CA 94533
Estimated Value: $364,000 - $482,499
3
Beds
2
Baths
1,269
Sq Ft
$338/Sq Ft
Est. Value
About This Home
This home is located at 2281 Dover Ave, Fairfield, CA 94533 and is currently estimated at $428,875, approximately $337 per square foot. 2281 Dover Ave is a home located in Solano County with nearby schools including Dover Elementary School, Grange Middle School, and Fairfield High School.
Ownership History
Date
Name
Owned For
Owner Type
Purchase Details
Closed on
May 5, 2017
Sold by
Holder Nicole
Bought by
Holder Jason R
Current Estimated Value
Home Financials for this Owner
Home Financials are based on the most recent Mortgage that was taken out on this home.
Original Mortgage
$218,000
Outstanding Balance
$181,492
Interest Rate
4.14%
Mortgage Type
New Conventional
Estimated Equity
$247,383
Purchase Details
Closed on
Jun 11, 2014
Sold by
Lee Nicole Marie
Bought by
Holder Jason R
Home Financials for this Owner
Home Financials are based on the most recent Mortgage that was taken out on this home.
Original Mortgage
$6,555
Interest Rate
4.25%
Mortgage Type
Unknown
Purchase Details
Closed on
May 14, 1996
Sold by
Parsons Parsons F and Parsons J C
Bought by
Parsons Franklin D and Parsons Josephine C
Create a Home Valuation Report for This Property
The Home Valuation Report is an in-depth analysis detailing your home's value as well as a comparison with similar homes in the area
Home Values in the Area
Average Home Value in this Area
Purchase History
We collect this data history from publicly available records. To have your information removed, we recommend requesting removal directly through your county’s website.
| Date | Buyer | Sale Price | Title Company |
|---|---|---|---|
| Holder Jason R | -- | Fidelity National Title Co | |
| Holder Jason R | -- | Fidelity National Title Co | |
| Holder Jason R | $218,500 | Fidelity National Title Co | |
| Parsons Franklin D | -- | -- |
Source: Public Records
Mortgage History
We collect this data history from publicly available records. To have your information removed, we recommend requesting removal directly through your county’s website.
| Date | Status | Borrower | Loan Amount |
|---|---|---|---|
| Open | Holder Jason R | $218,000 | |
| Closed | Holder Jason R | $6,555 | |
| Closed | Holder Jason R | $214,541 |
Source: Public Records
Tax History
| Year | Tax Paid | Tax Assessment Tax Assessment Total Assessment is a certain percentage of the fair market value that is determined by local assessors to be the total taxable value of land and additions on the property. | Land | Improvement |
|---|---|---|---|---|
| 2025 | $3,006 | $267,839 | $61,288 | $206,551 |
| 2024 | $3,006 | $262,588 | $60,087 | $202,501 |
| 2023 | $2,914 | $257,440 | $58,909 | $198,531 |
| 2022 | $2,879 | $252,393 | $57,754 | $194,639 |
| 2021 | $2,851 | $247,445 | $56,622 | $190,823 |
| 2020 | $2,784 | $244,909 | $56,042 | $188,867 |
| 2019 | $2,716 | $240,108 | $54,944 | $185,164 |
| 2018 | $2,803 | $235,401 | $53,867 | $181,534 |
| 2017 | $2,674 | $230,786 | $52,811 | $177,975 |
| 2016 | $2,650 | $226,262 | $51,776 | $174,486 |
| 2015 | $2,474 | $222,865 | $50,999 | $171,866 |
| 2014 | $514 | $51,390 | $11,998 | $39,392 |
Source: Public Records
Map
Nearby Homes
- 237 Del Loma Ct
- 222 Del Luz Ct
- 648 San Lorenzo St
- 2438 Oceanic Dr
- 806 Meadowlark Dr
- 213 Santa Cruz Dr
- 2386 Baltic Ct
- 2423 Baltic Dr
- 806 Finch Way
- 536 San Dimas St
- 772 Largo Ct
- 760 Normandy Ct
- 725 San Pedro St
- 500 Asbury Ln
- 366 San Andreas St
- 50 Anza Ct
- 77 Anza Ct
- 443 Hartwick Ln
- 14 Balboa Ct
- 1812 San Jose Place
- 2269 Dover Ave
- 2280 Santa Clara Dr
- 2274 Santa Clara Dr
- 2286 Santa Clara Dr
- 2263 Dover Ave
- 2287 Dover Ave
- 6 El Cerrito Ct
- 8 El Cerrito Ct
- 5 El Cerrito Ct
- 9 El Cerrito Ct
- 25 El Dorado Ct
- 2300 Santa Clara Dr
- 10 El Cerrito Ct
- 4 El Cerrito Ct
- 26 El Dorado Ct Unit 1
- 2262 Santa Clara Dr
- 2306 Santa Clara Dr
- 2219 Dover Ave
- 27 El Dorado Ct
- 3 El Cerrito Ct
Your Personal Tour Guide
Ask me questions while you tour the home.