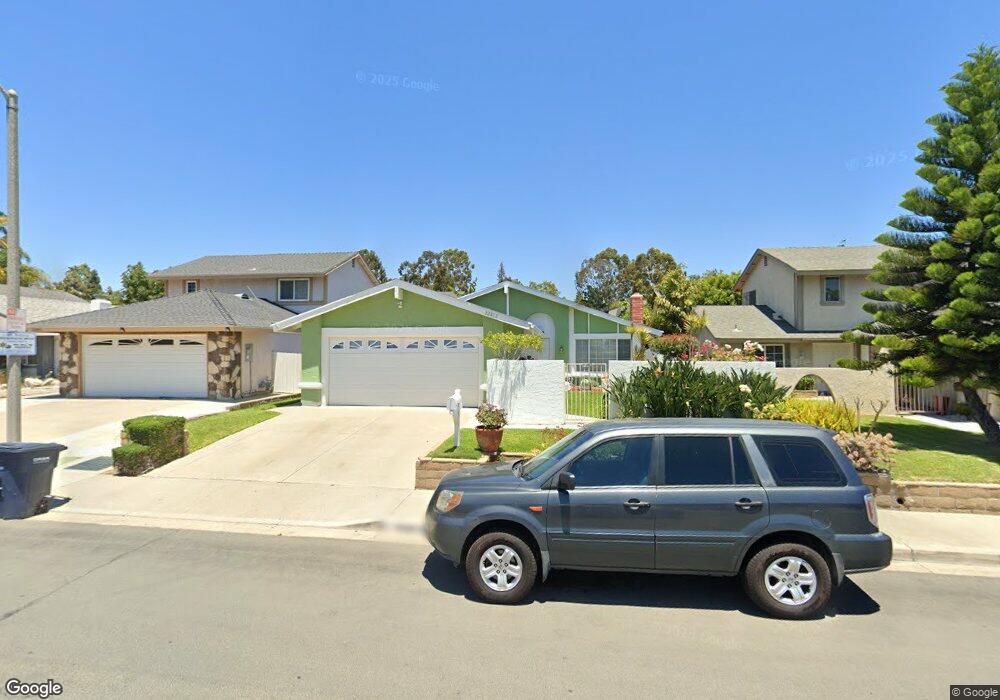
22812 Nolan St Lake Forest, CA 92630
Estimated Value: $1,181,820 - $1,264,000
4
Beds
2
Baths
1,800
Sq Ft
$680/Sq Ft
Est. Value
About This Home
This home is located at 22812 Nolan St, Lake Forest, CA 92630 and is currently estimated at $1,223,455, approximately $679 per square foot. 22812 Nolan St is a home located in Orange County with nearby schools including Olivewood Elementary School, Serrano Intermediate School, and El Toro High School.
Ownership History
Date
Name
Owned For
Owner Type
Purchase Details
Closed on
Aug 23, 2002
Sold by
Reeve Derek
Bought by
Olivares Ernesto A and Olivares Christine O
Current Estimated Value
Home Financials for this Owner
Home Financials are based on the most recent Mortgage that was taken out on this home.
Original Mortgage
$337,400
Outstanding Balance
$139,601
Interest Rate
6.24%
Estimated Equity
$1,083,854
Purchase Details
Closed on
Feb 13, 2002
Sold by
Serrano Jack and Castiega Darlene
Bought by
Reeve Derek
Home Financials for this Owner
Home Financials are based on the most recent Mortgage that was taken out on this home.
Original Mortgage
$292,500
Interest Rate
7.25%
Purchase Details
Closed on
Jul 9, 1997
Sold by
Robison Joel B and Robison Bonnie J
Bought by
Serrano Jack and Castiega Darlene
Home Financials for this Owner
Home Financials are based on the most recent Mortgage that was taken out on this home.
Original Mortgage
$164,571
Interest Rate
7.58%
Mortgage Type
FHA
Create a Home Valuation Report for This Property
The Home Valuation Report is an in-depth analysis detailing your home's value as well as a comparison with similar homes in the area
Home Values in the Area
Average Home Value in this Area
Purchase History
| Date | Buyer | Sale Price | Title Company |
|---|---|---|---|
| Olivares Ernesto A | $375,000 | Orange Coast Title | |
| Reeve Derek | $325,000 | United Title Company | |
| Serrano Jack | $172,000 | Fidelity National Title Ins |
Source: Public Records
Mortgage History
| Date | Status | Borrower | Loan Amount |
|---|---|---|---|
| Open | Olivares Ernesto A | $337,400 | |
| Previous Owner | Reeve Derek | $292,500 | |
| Previous Owner | Serrano Jack | $164,571 |
Source: Public Records
Tax History
| Year | Tax Paid | Tax Assessment Tax Assessment Total Assessment is a certain percentage of the fair market value that is determined by local assessors to be the total taxable value of land and additions on the property. | Land | Improvement |
|---|---|---|---|---|
| 2025 | $5,643 | $546,559 | $413,164 | $133,395 |
| 2024 | $5,643 | $535,843 | $405,063 | $130,780 |
| 2023 | $5,511 | $525,337 | $397,121 | $128,216 |
| 2022 | $5,412 | $515,037 | $389,335 | $125,702 |
| 2021 | $5,305 | $504,939 | $381,701 | $123,238 |
| 2020 | $5,257 | $499,762 | $377,787 | $121,975 |
| 2019 | $5,153 | $489,963 | $370,379 | $119,584 |
| 2018 | $5,056 | $480,356 | $363,116 | $117,240 |
| 2017 | $4,956 | $470,938 | $355,996 | $114,942 |
| 2016 | $4,874 | $461,704 | $349,015 | $112,689 |
| 2015 | $4,815 | $454,769 | $343,772 | $110,997 |
| 2014 | $4,711 | $445,861 | $337,038 | $108,823 |
Source: Public Records
Map
Nearby Homes
- 23921 Barton St
- 22682 S Canada Ct
- 22832 Sailwind Way
- 22706 Wood Lake Ln
- 22845 Orchid Creek Ln
- 22627 Lakeside Ln
- 24201 Jagger St
- 24282 Ursula Cir
- 23976 Carmel Dr
- 22733 Islamare Ln
- 24001 Muirlands Blvd Unit 31
- 24001 Muirlands Blvd Unit 352
- 24001 Muirlands Blvd Unit 147
- 24001 Muirlands Blvd Unit 315
- 24001 Muirlands Blvd Unit 83
- 24001 Muirlands Blvd Unit 178
- 24001 Muirlands Blvd Unit 138
- 24001 Muirlands Blvd Unit 326
- 24001 Muirlands Blvd Unit 186
- 24001 Muirlands Blvd Unit 34
- 22804 Nolan St
- 22822 Nolan St
- 22802 Nolan St
- 22796 Nolan St
- 22781 Avalon St
- 22832 Nolan St
- 22791 Avalon St
- 22775 Avalon St
- 22771 Avalon St
- 22801 Avalon St
- 22792 Nolan St
- 22811 Nolan St
- 22821 Nolan St
- 22761 Avalon St
- 22795 Nolan St
- 22831 Nolan St
- 22782 Nolan St
- 22791 Nolan St
- 23972 Oswego St
- 22782 Avalon St
Your Personal Tour Guide
Ask me questions while you tour the home.