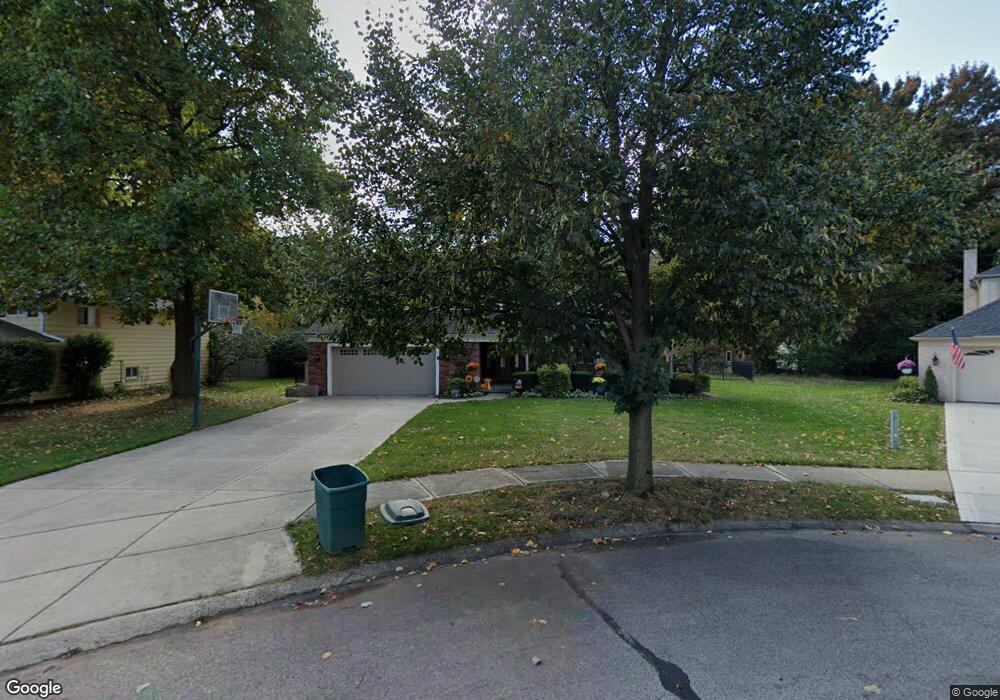
22827 Vine Ct Rocky River, OH 44116
Estimated Value: $521,547 - $609,000
4
Beds
4
Baths
2,488
Sq Ft
$226/Sq Ft
Est. Value
About This Home
This home is located at 22827 Vine Ct, Rocky River, OH 44116 and is currently estimated at $563,387, approximately $226 per square foot. 22827 Vine Ct is a home located in Cuyahoga County with nearby schools including Dover Intermediate School, Lee Burneson Middle School, and Westlake High School.
Ownership History
Date
Name
Owned For
Owner Type
Purchase Details
Closed on
Dec 23, 2021
Sold by
Kopechek Lynne A
Bought by
Kopechek Gary J and Kopechek Lynne A
Current Estimated Value
Purchase Details
Closed on
Apr 24, 2003
Sold by
Kopechek Gary J and Kopechek Lynne A
Bought by
Kopechek Lynne A
Purchase Details
Closed on
Jan 31, 1996
Sold by
Brady Michael L
Bought by
Kopechek Gary J and Kopechek Lynne A
Home Financials for this Owner
Home Financials are based on the most recent Mortgage that was taken out on this home.
Original Mortgage
$130,000
Interest Rate
7.24%
Mortgage Type
New Conventional
Purchase Details
Closed on
May 19, 1987
Sold by
Minoff Barry Jay
Bought by
Brady Michael L
Purchase Details
Closed on
Apr 1, 1985
Sold by
Joan Carol
Bought by
Minoff Barry Jay
Purchase Details
Closed on
Jan 1, 1975
Bought by
Joan Carol
Create a Home Valuation Report for This Property
The Home Valuation Report is an in-depth analysis detailing your home's value as well as a comparison with similar homes in the area
Home Values in the Area
Average Home Value in this Area
Purchase History
| Date | Buyer | Sale Price | Title Company |
|---|---|---|---|
| Kopechek Gary J | -- | Bidar Mohammed J | |
| Kopechek Lynne A | -- | -- | |
| Kopechek Gary J | $190,000 | -- | |
| Brady Michael L | $134,000 | -- | |
| Minoff Barry Jay | -- | -- | |
| Joan Carol | -- | -- |
Source: Public Records
Mortgage History
| Date | Status | Borrower | Loan Amount |
|---|---|---|---|
| Previous Owner | Kopechek Gary J | $130,000 |
Source: Public Records
Tax History Compared to Growth
Tax History
| Year | Tax Paid | Tax Assessment Tax Assessment Total Assessment is a certain percentage of the fair market value that is determined by local assessors to be the total taxable value of land and additions on the property. | Land | Improvement |
|---|---|---|---|---|
| 2024 | $9,550 | $172,760 | $24,535 | $148,225 |
| 2023 | $8,713 | $130,700 | $24,400 | $106,300 |
| 2022 | $8,653 | $130,690 | $24,395 | $106,295 |
| 2021 | $7,924 | $130,690 | $24,400 | $106,300 |
| 2020 | $7,953 | $114,630 | $21,390 | $93,240 |
| 2019 | $7,814 | $327,500 | $61,100 | $266,400 |
| 2018 | $7,209 | $114,630 | $21,390 | $93,240 |
| 2017 | $6,804 | $90,900 | $18,240 | $72,660 |
| 2016 | $6,624 | $90,900 | $18,240 | $72,660 |
| 2015 | $6,738 | $90,900 | $18,240 | $72,660 |
| 2014 | $6,738 | $88,240 | $17,710 | $70,530 |
Source: Public Records
Map
Nearby Homes
- 22788 Vine Ct
- 3913 W 227th St
- 23045 Clifford Dr
- 4002 W 227th St
- 23225 Marion Rd
- 3534 Palmer Dr
- 4097 W 227th St
- 3385 Palmer Dr
- 23240 Pheasant Ln Unit 7
- 23547 Quail Hollow
- 1 Aberdeen Ct
- 2187 Vuila Way
- 22701 Center Ridge Rd Unit 207
- 2161 Vuila Ct
- 2160 Vuila Ct
- 4140 W 220th St
- 2375 Clague Rd
- 2169 Vuila Ct
- 2168 Vuila Ct
- 22555 Center Ridge Rd Unit 403
- 22807 Vine Ct
- 22847 Vine Ct
- 22787 Vine Ct
- 22930 Westwood Rd
- 22920 Westwood Rd
- 22868 Vine Ct
- 22940 Westwood Rd
- 22900 Westwood Rd
- 22808 Vine Ct
- 22828 Vine Ct
- 22767 Vine Ct
- 22848 Vine Ct
- 22860 Westwood Rd
- 22768 Vine Ct
- 22747 Vine Ct
- 22984 Westwood Rd
- 22810 Westwood Rd
- 22748 Vine Ct
- 22925 Westwood Rd
- 22935 Westwood Rd