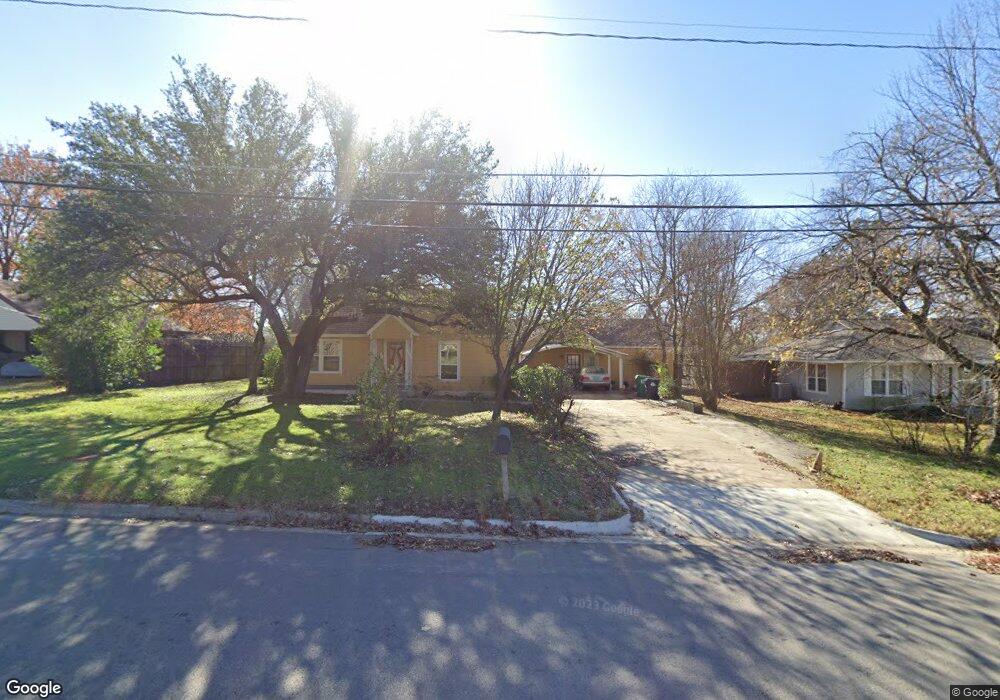
2283 Scripture St Denton, TX 76201
Rayzor Ranch NeighborhoodEstimated Value: $317,000 - $406,750
3
Beds
2
Baths
2,078
Sq Ft
$174/Sq Ft
Est. Value
About This Home
This home is located at 2283 Scripture St, Denton, TX 76201 and is currently estimated at $361,438, approximately $173 per square foot. 2283 Scripture St is a home located in Denton County with nearby schools including Newton Rayzor Elementary School, Calhoun Middle School, and Denton High School.
Ownership History
Date
Name
Owned For
Owner Type
Purchase Details
Closed on
Apr 20, 2012
Sold by
Butler Aerts Marie and Butler Marie Elaine
Bought by
Aerts Cyrillus
Current Estimated Value
Purchase Details
Closed on
Nov 11, 1999
Sold by
Stafford Charles R and Abbott Judith P
Bought by
Aerts Cyrillus
Home Financials for this Owner
Home Financials are based on the most recent Mortgage that was taken out on this home.
Original Mortgage
$117,500
Interest Rate
7.83%
Purchase Details
Closed on
Mar 10, 1994
Sold by
Key Custom Homes Inc
Bought by
Farmer Ii Hal D and Farmer Julie A
Home Financials for this Owner
Home Financials are based on the most recent Mortgage that was taken out on this home.
Original Mortgage
$320,000
Interest Rate
6.95%
Purchase Details
Closed on
Feb 7, 1989
Sold by
Johnson Denver Paul and Grace Johnson E
Bought by
Abbott Judith P
Create a Home Valuation Report for This Property
The Home Valuation Report is an in-depth analysis detailing your home's value as well as a comparison with similar homes in the area
Home Values in the Area
Average Home Value in this Area
Purchase History
| Date | Buyer | Sale Price | Title Company |
|---|---|---|---|
| Aerts Cyrillus | -- | None Available | |
| Aerts Cyrillus | -- | Title Resources | |
| Farmer Ii Hal D | -- | -- | |
| Abbott Judith P | $4,620 | -- | |
| Abbott Judith P | $4,620 | -- |
Source: Public Records
Mortgage History
| Date | Status | Borrower | Loan Amount |
|---|---|---|---|
| Previous Owner | Aerts Cyrillus | $117,500 | |
| Previous Owner | Farmer Ii Hal D | $320,000 | |
| Closed | Aerts Cyrillus | $0 |
Source: Public Records
Tax History
| Year | Tax Paid | Tax Assessment Tax Assessment Total Assessment is a certain percentage of the fair market value that is determined by local assessors to be the total taxable value of land and additions on the property. | Land | Improvement |
|---|---|---|---|---|
| 2025 | $4,141 | $333,311 | $246,845 | $178,528 |
| 2024 | $5,849 | $303,010 | $0 | $0 |
| 2023 | $4,063 | $275,464 | $106,427 | $175,662 |
| 2022 | $5,316 | $250,422 | $216,204 | $107,922 |
| 2021 | $5,061 | $227,656 | $84,679 | $142,977 |
| 2020 | $4,874 | $213,235 | $84,679 | $128,556 |
| 2019 | $4,679 | $196,097 | $84,679 | $127,962 |
| 2018 | $4,306 | $178,270 | $84,679 | $122,433 |
| 2017 | $4,006 | $162,064 | $84,679 | $131,939 |
| 2016 | $3,498 | $147,331 | $46,121 | $111,041 |
| 2015 | $3,008 | $133,937 | $46,121 | $87,816 |
| 2014 | $3,008 | $130,834 | $61,755 | $81,286 |
| 2013 | -- | $118,940 | $41,685 | $77,255 |
Source: Public Records
Map
Nearby Homes
- 2271 Scripture St
- 903 Stanley St
- 910 Stanley St Unit 3
- 910 Stanley St Unit 1
- 910 Stanley St Unit 2
- 1027 Stanley St
- 218 N Texas Blvd Unit 105
- 218 N Texas Blvd Unit 103
- 218 N Texas Blvd Unit 113
- 218 N Texas Blvd
- 2404 Louise St Unit 2404 & 2420
- 321 Fry St
- 406 Fry St
- 1114 W Congress St
- 433 Fulton St
- 314 Fulton St
- 9909 Morning Cloak Dr
- 1011 Crescent St
- 1900 Malone St
- 215 Bernard St
- 2279 Scripture St
- 2287 Scripture St
- 2289 Scripture St
- 2275 Scripture St
- 2291 Scripture St
- 404 N Bonnie Brae St
- 400 N Bonnie Brae St
- 2322 Houston Place
- 0000 Bonnie Brae
- 324 N Bonnie Brae St
- 2293 Scripture St
- 2316 Houston Place
- 320 N Bonnie Brae St
- 2265 Scripture St
- 407 Thomas St
- 316 N Bonnie Brae St
- 2310 Houston Place
- 2300 Scripture St
- 403 Thomas St
- 314 N Bonnie Brae St
Your Personal Tour Guide
Ask me questions while you tour the home.