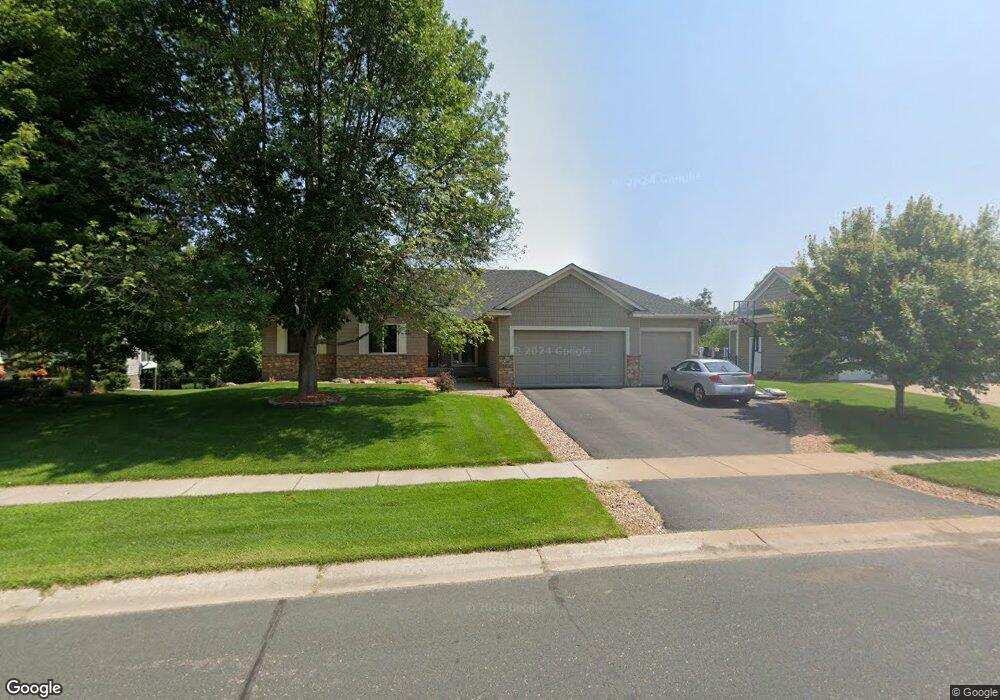
22837 Zion Pkwy NW Bethel, MN 55005
Estimated Value: $464,000 - $543,000
5
Beds
3
Baths
1,636
Sq Ft
$300/Sq Ft
Est. Value
About This Home
This home is located at 22837 Zion Pkwy NW, Bethel, MN 55005 and is currently estimated at $490,684, approximately $299 per square foot. 22837 Zion Pkwy NW is a home located in Anoka County with nearby schools including East Bethel Community School, St. Francis Middle School, and St. Francis High School.
Ownership History
Date
Name
Owned For
Owner Type
Purchase Details
Closed on
Apr 27, 2017
Sold by
Grant Jeffrey N and Grant Patricia A
Bought by
Kaczmarek John Thomas and Kaczmarek Katie Lynn
Current Estimated Value
Home Financials for this Owner
Home Financials are based on the most recent Mortgage that was taken out on this home.
Original Mortgage
$283,400
Outstanding Balance
$236,963
Interest Rate
4.3%
Mortgage Type
New Conventional
Estimated Equity
$253,721
Purchase Details
Closed on
Jun 24, 2011
Sold by
Carls Chad A and Carls Jennifer R
Bought by
Grant Jeffrey N and Grant Patricia A
Home Financials for this Owner
Home Financials are based on the most recent Mortgage that was taken out on this home.
Original Mortgage
$156,750
Interest Rate
4.63%
Mortgage Type
New Conventional
Purchase Details
Closed on
Aug 5, 2003
Sold by
Turtle Moon Inc
Bought by
Johnson Homes Inc
Create a Home Valuation Report for This Property
The Home Valuation Report is an in-depth analysis detailing your home's value as well as a comparison with similar homes in the area
Home Values in the Area
Average Home Value in this Area
Purchase History
| Date | Buyer | Sale Price | Title Company |
|---|---|---|---|
| Kaczmarek John Thomas | $317,900 | First American Title Insuran | |
| Grant Jeffrey N | $165,000 | -- | |
| Johnson Homes Inc | $72,900 | -- |
Source: Public Records
Mortgage History
| Date | Status | Borrower | Loan Amount |
|---|---|---|---|
| Open | Kaczmarek John Thomas | $283,400 | |
| Previous Owner | Grant Jeffrey N | $156,750 |
Source: Public Records
Tax History Compared to Growth
Tax History
| Year | Tax Paid | Tax Assessment Tax Assessment Total Assessment is a certain percentage of the fair market value that is determined by local assessors to be the total taxable value of land and additions on the property. | Land | Improvement |
|---|---|---|---|---|
| 2025 | $3,693 | $465,900 | $52,200 | $413,700 |
| 2024 | $3,693 | $457,700 | $52,200 | $405,500 |
| 2023 | $3,067 | $481,800 | $61,000 | $420,800 |
| 2022 | $3,033 | $443,600 | $58,100 | $385,500 |
| 2021 | $2,922 | $378,900 | $41,900 | $337,000 |
| 2020 | $2,867 | $341,000 | $41,900 | $299,100 |
| 2019 | $2,943 | $326,000 | $41,900 | $284,100 |
| 2018 | $2,896 | $316,200 | $0 | $0 |
| 2017 | $2,998 | $300,500 | $0 | $0 |
| 2016 | $3,041 | $285,300 | $0 | $0 |
| 2015 | $2,828 | $285,300 | $50,600 | $234,700 |
| 2014 | -- | $233,100 | $23,900 | $209,200 |
Source: Public Records
Map
Nearby Homes
- 2609 226th Ln NW
- 22560 Poppy St NW
- 22507 Zion Pkwy NW
- 3428 227th Ave NW
- 23016 Eidelweiss St NW
- 2747 229th Ln NW
- 2748 229th Ln NW
- 2755 229th Ln NW
- 2752 229th Ln NW
- 2729 229th Ln NW
- 2718 229th Ln NW
- 2715 229th Ln NW
- 2747 230th Ct NW
- 23041 Eidelweiss St NW
- 23057 Eidelweiss St NW
- 2710 230th Ct NW
- 22509 Tulip St NW
- 23080 Bittersweet St NW
- 23116 Eidelweiss St NW
- 3662 225th Ln NW
- 22837 22837 Zion Pkwy NW
- 22839 Zion Pkwy NW
- 22835 Zion Pkwy NW
- 22839 22839 Zion Pkwy NW
- 22841 22841 Zion Pkwy NW
- 22841 22841 Zion-Parkway-nw
- 22833 22833 Zion Pkwy NW
- 22841 Zion Pkwy NW
- 22838 Zion Pkwy NW
- 22833 Zion Pkwy NW
- 22838 22838 Zion-Parkway-nw
- 22840 22840 Zion--Nw
- 22836 Zion Pkwy NW
- 22836 22836 Zion-Parkway-nw
- 22836 22836 Zion Pkwy NW
- 22831 Zion Pkwy NW
- 22843 Zion Pkwy NW
- 22842 Zion Pkwy NW
- 22834 Zion Pkwy NW
- 22842 22842 Zion Pkwy NW