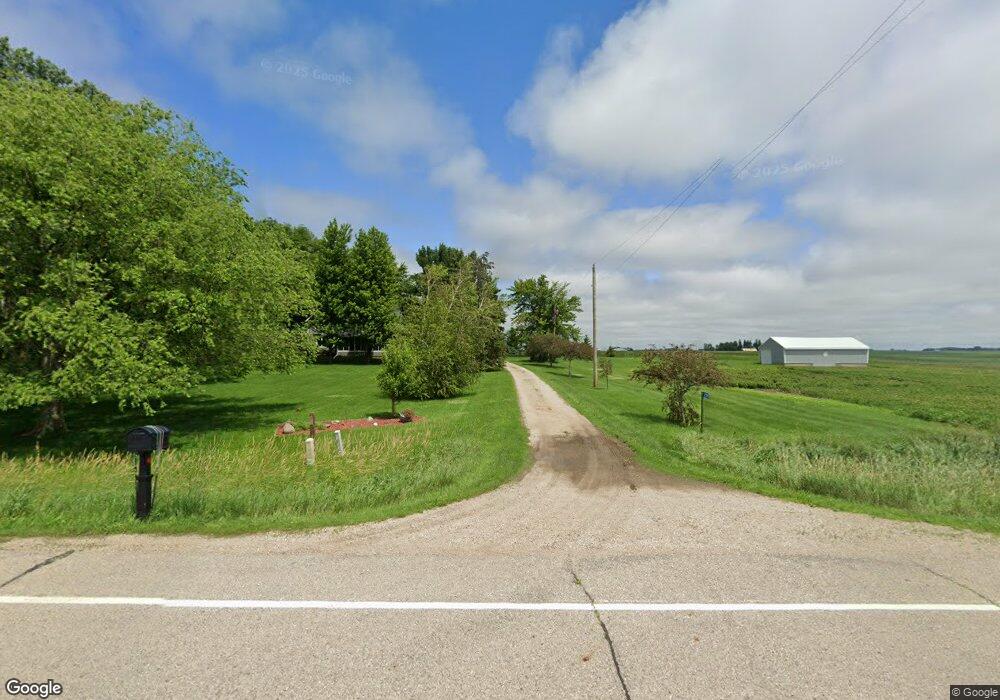
2285 260th St Garner, IA 50438
Estimated Value: $195,000 - $317,858
3
Beds
1
Bath
1,672
Sq Ft
$157/Sq Ft
Est. Value
About This Home
This home is located at 2285 260th St, Garner, IA 50438 and is currently estimated at $262,965, approximately $157 per square foot. 2285 260th St is a home located in Hancock County.
Ownership History
Date
Name
Owned For
Owner Type
Purchase Details
Closed on
Apr 1, 2013
Sold by
Estate Of Ruby Boehnke
Bought by
Ziesmer David and Ziesmer Rebecca
Current Estimated Value
Home Financials for this Owner
Home Financials are based on the most recent Mortgage that was taken out on this home.
Original Mortgage
$103,000
Outstanding Balance
$72,671
Interest Rate
3.46%
Mortgage Type
New Conventional
Estimated Equity
$190,294
Purchase Details
Closed on
Jul 18, 2007
Sold by
Boehnke Ruby H
Bought by
Ziesmer David and Ziesmer Rebecca
Create a Home Valuation Report for This Property
The Home Valuation Report is an in-depth analysis detailing your home's value as well as a comparison with similar homes in the area
Home Values in the Area
Average Home Value in this Area
Purchase History
| Date | Buyer | Sale Price | Title Company |
|---|---|---|---|
| Ziesmer David | $100,000 | None Available | |
| Ziesmer David | $100,000 | None Available |
Source: Public Records
Mortgage History
| Date | Status | Borrower | Loan Amount |
|---|---|---|---|
| Open | Ziesmer David | $103,000 | |
| Closed | Ziesmer David | $0 |
Source: Public Records
Tax History Compared to Growth
Tax History
| Year | Tax Paid | Tax Assessment Tax Assessment Total Assessment is a certain percentage of the fair market value that is determined by local assessors to be the total taxable value of land and additions on the property. | Land | Improvement |
|---|---|---|---|---|
| 2025 | $1,846 | $183,000 | $47,450 | $135,550 |
| 2024 | $1,846 | $165,290 | $34,180 | $131,110 |
| 2023 | $1,832 | $165,290 | $34,180 | $131,110 |
| 2022 | $1,390 | $142,620 | $24,800 | $117,820 |
| 2021 | $1,982 | $107,940 | $26,880 | $81,060 |
| 2020 | $28 | $69,110 | $27,210 | $41,900 |
| 2019 | $1,062 | $69,110 | $27,210 | $41,900 |
| 2018 | $977 | $82,460 | $38,560 | $43,900 |
| 2017 | $1,088 | $101,480 | $0 | $0 |
| 2016 | $1,036 | $101,480 | $0 | $0 |
| 2015 | $1,075 | $111,910 | $0 | $0 |
| 2014 | $1,096 | $111,910 | $0 | $0 |
Source: Public Records
Map
Nearby Homes