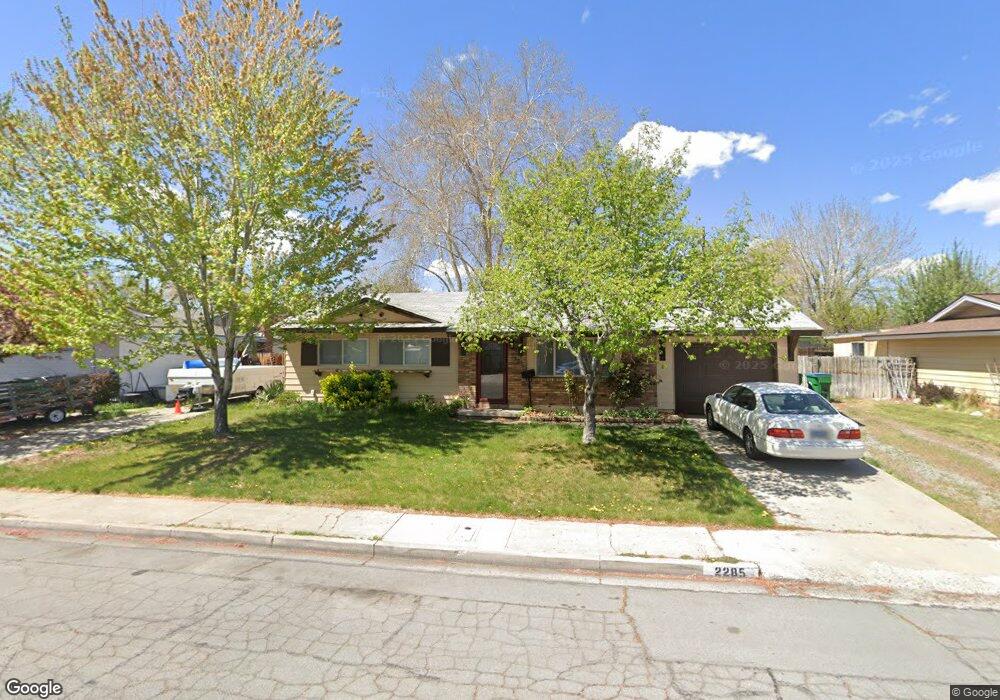
2285 Logan Way Sparks, NV 89431
North Rock NeighborhoodEstimated Value: $376,577 - $419,000
3
Beds
1
Bath
1,120
Sq Ft
$352/Sq Ft
Est. Value
About This Home
This home is located at 2285 Logan Way, Sparks, NV 89431 and is currently estimated at $394,144, approximately $351 per square foot. 2285 Logan Way is a home located in Washoe County with nearby schools including Alice Maxwell Elementary School, Sparks Middle School, and Sparks High School.
Ownership History
Date
Name
Owned For
Owner Type
Purchase Details
Closed on
Feb 12, 2007
Sold by
Lightfoot Donald K and Lightfoot Judith D
Bought by
Johnson David A and Johnson Jennifer U
Current Estimated Value
Home Financials for this Owner
Home Financials are based on the most recent Mortgage that was taken out on this home.
Original Mortgage
$143,000
Outstanding Balance
$85,794
Interest Rate
6.19%
Mortgage Type
Unknown
Estimated Equity
$308,350
Purchase Details
Closed on
Apr 25, 2001
Sold by
Smedley Barbara H and Mealer Corrine
Bought by
Johnson David A and Johnson Jennifer U
Home Financials for this Owner
Home Financials are based on the most recent Mortgage that was taken out on this home.
Original Mortgage
$118,146
Interest Rate
6.98%
Mortgage Type
FHA
Purchase Details
Closed on
May 31, 1997
Sold by
Krupp Christena L R
Bought by
Krupp Christena L and Christena Krupp Trust
Purchase Details
Closed on
Apr 18, 1997
Sold by
Krupp Christena L
Bought by
Krupp Christena L and Christena Krupp Trust
Create a Home Valuation Report for This Property
The Home Valuation Report is an in-depth analysis detailing your home's value as well as a comparison with similar homes in the area
Home Values in the Area
Average Home Value in this Area
Purchase History
| Date | Buyer | Sale Price | Title Company |
|---|---|---|---|
| Johnson David A | -- | Ticor Title Of Nevada Inc | |
| Johnson David A | $120,000 | -- | |
| Krupp Christena L | -- | -- | |
| Krupp Christena L | -- | -- |
Source: Public Records
Mortgage History
| Date | Status | Borrower | Loan Amount |
|---|---|---|---|
| Open | Johnson David A | $143,000 | |
| Previous Owner | Johnson David A | $118,146 |
Source: Public Records
Tax History Compared to Growth
Tax History
| Year | Tax Paid | Tax Assessment Tax Assessment Total Assessment is a certain percentage of the fair market value that is determined by local assessors to be the total taxable value of land and additions on the property. | Land | Improvement |
|---|---|---|---|---|
| 2025 | $942 | $52,992 | $34,825 | $18,167 |
| 2024 | $942 | $48,111 | $30,205 | $17,906 |
| 2023 | $874 | $48,363 | $31,780 | $16,583 |
| 2022 | $810 | $40,669 | $27,160 | $13,509 |
| 2021 | $753 | $31,408 | $18,235 | $13,173 |
| 2020 | $708 | $30,778 | $17,850 | $12,928 |
| 2019 | $674 | $29,901 | $17,605 | $12,296 |
| 2018 | $641 | $24,128 | $12,355 | $11,773 |
| 2017 | $625 | $22,807 | $11,235 | $11,572 |
| 2016 | $609 | $21,303 | $9,765 | $11,538 |
| 2015 | $608 | $20,036 | $8,645 | $11,391 |
| 2014 | $590 | $17,139 | $6,335 | $10,804 |
| 2013 | -- | $15,387 | $4,900 | $10,487 |
Source: Public Records
Map
Nearby Homes
- 1110 Xman Way
- 1705 9th St
- 1003 Sbragia Way
- 1160 York Way
- 1124 Sbragia Way
- 1125 Dodson Way
- 1945 4th St Unit 32
- 1945 4th St Unit 33
- 1945 4th St Unit 10
- 1345 Plymouth Way
- 1121 Greenbrae Dr
- 1940 4th St Unit 20
- 1940 4th St Unit 51
- 465 Lenwood Dr
- 2154 Oppio St
- 1365 Prospect Ave
- 780 Emerson Way
- 1595 York Way
- 0 N Mccarran Blvd Unit 250052909
- 3252 Holman Way
- 2225 Logan Way
- 2345 Logan Way
- 2280 Lexington Way
- 2340 Lexington Way
- 2220 Lexington Way
- 2280 Logan Way
- 2161 Logan Way
- 2395 Logan Way
- 2220 Logan Way
- 2340 Logan Way
- 2160 Lexington Way
- 2390 Lexington Way
- 2160 Logan Way
- 2390 Logan Way
- 2141 Logan Way
- 2140 Lexington Way
- 2285 Lexington Way
- 2140 Logan Way
- 2225 Lexington Way
- 2345 Lexington Way